Blueprint for using data in SharePoint Server
By combining Office SharePoint Server 2007, the 2007 Microsoft Office system, and the data in your enterprise, you can create a business solution that will make you feel right at home.

In this article
Building a business solution is like building a home
Let's say you want to build a quality home. If you have a lot of time and money, you could choose option A: Buy an undeveloped lot without utility hookups, hire an architect to design the house, and employ a contractor (who uses subcontractors) to painstakingly build it from the ground up. If you don't have a lot of time and money, you could choose option B: Purchase a modular home, choose a pre-designed architectural style and floor plan, and hire one contractor to quickly build it on a developed lot with utility hookups.
To build a quality business solution, the Microsoft Office system and Office SharePoint Server 2007 provide both options. Option A often requires funding, coding, and development, and is usually best left to the IT professionals. Option B combines the Microsoft Office system (your architect) with Office SharePoint Server 2007 (your home modules, developed lot, and utility hookups), a motivated information worker (your contractor), and templates and scenarios (your architectural styles and floor plans).
If you want help building a quality business solution by using option B, you've come to the right place. This article provides the big picture of using data in Office SharePoint Server 2007, along with many links to additional information that help you understand the details of the many features discussed and that can help you implement a solution.
Understanding data foundations
The foundation of any automated business solution that is based on the Microsoft Office system, whether at the enterprise, departmental, or workgroup level, is data and the fundamental ways that you can work with data.
The three types of data
Information is critical to efficiently run any enterprise, and data is the life-blood that supports it. Most enterprises spend major resources gathering, storing, updating, accessing, analyzing, reporting, and managing data. This data comes in three forms:
-
Structured data This type of data can be organized into tables and easily updated, sorted, filtered, and queried, and is commonly stored in flat files and databases. Structured data also includes metadata, often defined as "data about data". Metadata gives meaning and constraint to the data, and includes column headers, data types and formats, and validation rules. Examples of structured data include purchase orders, statistics, inventories, budgets, and sales.
-
Unstructured data This type of data is information that is stored in documents and presentations, and that cannot be automatically converted into structured data. Examples of unstructured data include memos, letters, publications, policies, proposals, specifications, slides, and resumes.
-
Semi-structured data This type of date contains structured data combined with a modest amount of unstructured data, such as comment and memo fields, document attachments, and graphics. Examples of unstructured data include status reports, formalized Request for Proposal (RFP) documents, performance reviews, and product catalogs.
You can work with all three types of data by using the Microsoft Office system and Office SharePoint Server 2007, but the focus of this article is on structured and semi-structured data.
Making connections to data
Structured and semi-structured data often comes from an external data source, such as an XML file, a workbook, or a database. This external data source is connected to your program through a data connection, which is a set of information that describes how to locate, log on, and access the external data source.
Connection information can also be stored in a connection file, such as an Office Data Connection (ODC) file (.odc). An ODC file uses custom HTML and XML tags to store the connection information and is used by most Office programs. Office InfoPath 2007 uses a similar Universal Data Connection (UDC) file (.udc). Connection files are particularly useful for sharing connections on a consistent basis, making connections more discoverable, helping to improve security, and easing data-source administration. The best way to share connection files is to put them in a secure and trusted location, such as a SharePoint Data Connection library, where appropriate users and programs can read the file, but only designated users can modify the file.
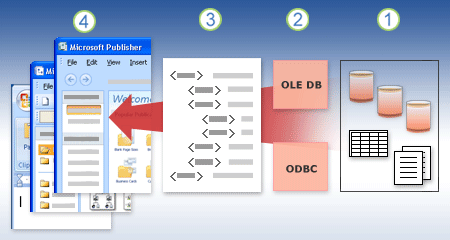
1. There are a variety of data sources that you can connect to: Microsoft SQL Server, Microsoft Office Access 2007, Office Excel 2007, and text files.
2. Each data source has an associated ODBC driver or OLE DB provider.
3. A connection file defines all of the information that you need to access and retrieve data from a data source.
4. Connection information is copied from a connection file into your program.
Microsoft Data Access Components (MDAC) 2.8, which is installed with Microsoft Windows, enables connecting to a wide variety of relational and non-relational data sources by using either Open Database Connectivity (ODBC) drivers or Object Linking and Embedding Database (OLE DB) providers. When you install the Microsoft Office system, additional ODBC drivers and OLE DB providers are added to your computer. You can also use ODBC drivers and OLE DB providers from other manufacturers to get information from sources other than Microsoft data sources. For information about installing these ODBC drivers or OLE DB providers, check the documentation for the database, or contact your database vendor.
Using the Microsoft Office system, you can create connections in many Office programs and use the Data Connection Wizard to connect to new data sources. You can also best view or edit the contents of an ODC file by using Office Excel 2007.
More information
| — | Import data into Office Publisher, Visio, or Word by using the Data Connection Wizard |
| — | |
Using data grids to work with data
The simplest way to work with data is often by using a data grid. A data grid is a tabular display of data in columns and rows that lets you easily sort, filter, query, and manipulate the data. Data grids also provide a way to obtain the correct set of data for you business solution from several data sources. For some users, a data grid is enough to effectively work with the data. For other users, you need more user-friendly ways to manage the data, such as forms, reports, and dashboards.
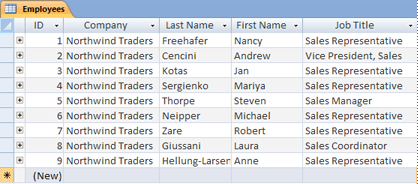
Using the Microsoft Office system and Office SharePoint Server 2007, you can create and use data grids by using the Access Web Datasheet, Access datasheets, and Excel tables.
Using forms to efficiently change data
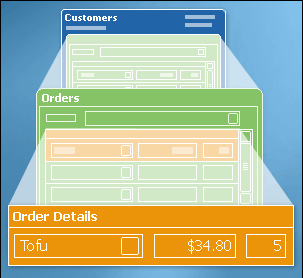 Structured and semi-structured data often needs updating and changing, and that's where forms come in to play. A form, whether printed or online, is a document or program component designed with a standard structure and format that makes it easier to gather, capture, organize, and edit data. Forms are windows through which users see and access your data. Online forms contain instructions, formatting, labels, and blank spaces for entering data, much like a printed form. Online forms also contain controls that display data or make it easier for users to enter or edit data, perform an action, or make a selection, such as list boxes, option buttons, and command buttons. A visually attractive form makes working with the data more pleasant and more efficient, and helps prevent incorrect data from being entered.
Using the Microsoft Office system and Office SharePoint Server 2007, you can create and use forms by using Access forms, InfoPath forms, SharePoint list forms, Data Views inserted as forms, and Form Web Parts.
Using reports to present data and make decisions
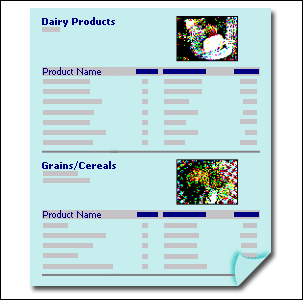 Structured and semi-structured data is commonly made available to users through business reports. A report is the presentation of data transformed into formatted and organized information according to specific business requirements. Examples of reports include budget forecasts, sales summaries, phone lists, mailing labels, and product catalogs. Reports can be a simple one-page synopsis or a hierarchical display of extensive data. A report may also contain subreports, vary based on parameters that are passed to it, and be highly interactive so that users can sort, filter, and drill down on or even drill through the data.
By using reports, information workers can make good business decisions by helping them to answer questions, focus on objectives, find best alternatives, devise correct strategies and tactics, determine consequences and trade-offs, and assess unknowns and risks.
Report users can be classified in the following way.
| Type of user | Example | Report actions |
| Power users | Data and business analysts | Create and customize reports, work with Online Analytical Processing (OLAP) PivotTable reports, use report authoring tools, conduct statistical analysis, and perform analytics using data-mining tools. |
| Moderate users | Managers and other information workers | Read detailed reports, customize and interact with reports by filtering, sorting, and setting parameters, and create ad hoc queries and reports. |
| Casual users | Frontline workers | Read standard, simple reports and access reports through simple displays, such as flowcharts. |
Using the Microsoft Office system, Office SharePoint Server 2007, and SQL Server, you can create and use a wide variety of reports by using Access, Excel, SQL Server Reporting Services, InfoPath (by using form merging) and Office SharePoint Designer 2007 (by using read-only Data Views).
Using dashboards and KPIs to act upon data
Business intelligence is a popular, industry-wide effort designed to gather, manage, and use data; to discern patterns and meaning; to make decisions, respond, and act; and therefore to improve the performance of your enterprise. Dashboards and key performance indicators (KPIs) are central to this effort.
Using dashboards
Dashboards (also called scorecards) are a vital business-intelligence technique that combines reporting and analytics to visualize critical information at the enterprise, departmental, and group level.
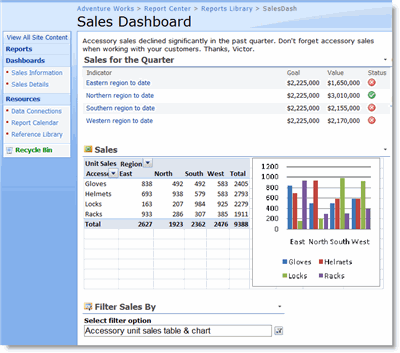
There are three types of dashboards: operational dashboards used to monitor daily work for employees, tactical dashboards for analysis of data and monitoring of monthly and quarterly activities, and strategic dashboards for long-term enterprise management. Dashboard data can be quantitative, such as order amounts, market share, profits, support calls, manufacturing defects, or Web page hits. Or dashboard data can be qualitative, such as Top 10 customers, key issues, current tasks awaiting completion, and critical news updates.
Using key performance indicators (KPIs)
An essential element of a dashboard is a key performance indicator (KPI), which is a visual cue (such as up and down arrows, stop light signals, and colored circles) that communicates the amount of progress made toward an important business goal. A KPI is a quantifiable measurement, such as monthly gross profit or quarterly employee turnover, that is used to monitor an organization's performance. KPIs are valuable for teams, managers, and businesses to evaluate quickly the progress made against measurable goals and to make good decisions based on three fundamental questions: "What am I ahead or behind on?", "How far ahead or behind am I?", and "What is the minimum I have completed?".
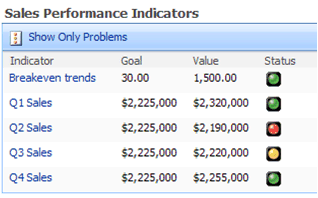 Each KPI has a goal, status, and trend. For example, a common KPI is department monthly sales. After careful planning, a quarterly sales goal (or target) is defined for each department. A dashboard or scorecard displays the weekly status of this goal, whether it is on track, ahead or behind, perhaps by using colors or company-defined, standard icons. The trends over the past years may also be summarized in a chart, and sometimes projected for the next year.
Leveraging data within Office SharePoint Server 2007
Office SharePoint Server 2007 facilitates collaboration with other employees by making it easy to manage and share documents, sites, and workspaces, and by supporting common business activities that use all of the three types of data described earlier. Examples include:
-
Workgroups and departments that need to collaborate on projects, communicate the business purpose, measure success, organize teams and tasks, develop and track schedules and milestones, identify costs, and produce deliverables.
-
Businesses that need to manage lots of documents, audit processes, communicate policies, and retain, label, and locate voluminous records.
Office SharePoint Server 2007 also creates a solid infrastructure for developing additional business solutions that use all three types of data. For the information worker, the following Office SharePoint Server 2007 components stand out as important elements in building an automated business solution based on structured and semi-structured data with little or no code. These components, which work alone or work well together, are your "home modules, developed lots, and utility hookups" that can help you quickly build a business solution.
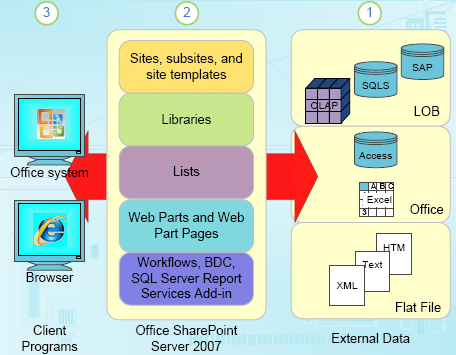
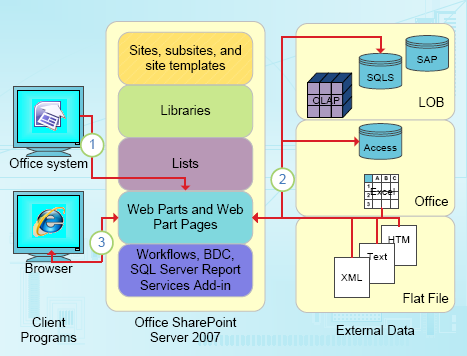
1. Using the Microsoft Office system and Office SharePoint Server 2007, you can work with many types of external data, including line-of-business (LOB) data, Office data sources, and flat files.
2. Office SharePoint Server 2007 has many components designed to manipulate external data in a variety of ways.
3. You can access this external data, either through an Office desktop program or a browser, such as Windows Internet Explorer.
SharePoint lists
A SharePoint site usually includes many default lists, including Links, Announcements, Contacts, Issue Tracking, Surveys, and Tasks that you can use as a focal point for a business solution. In many cases, these default lists can provide quick, effective solutions with little or no modifications. For example, you can use: Surveys, which include conditional branching and page breaks, for employee and customer satisfaction assessments, and Issue Tracking, which has versioning and version-history storage, for deeper analysis of workgroup projects and common work tasks.

Lists are rich and flexible and have many built-in features that provide a robust way to store, share, and work with structured and semi-structured data. You can:
-
Include many types of data, such as dates, pictures, formulas and calculations based on other columns, append-only fields (useful for logging and tracking applications), and lookup fields where you can select a value from another list field.
-
Create list views to organize, sort, and filter data in different and specific ways; change the metadata, such as adding and deleting columns, and modifying validation rules; and use lists consistently across SharePoint sites with content types, site columns, and templates.
-
Create custom lists, display the data in Web Parts and Web Part Pages, and import, export, and link to data from other programs, such as Excel and Access.
-
Track versions and detailed history, require approval to modify data, use item-level and folder security, check-in and check-out, and automatically stay informed about changes by using alerts and RSS feeds.
-
Organize content in a single list into folders for added convenience and better performance, and improve performance in general with large lists by using indexing.
The Access Web Datasheet (previously known as the Datasheet view) provides a data grid for viewing and editing data for many types of lists. You may find the Access Web Datasheet more convenient and powerful than the standard list view. It displays the contents of a list or a document library in rows and columns. You can add and edit rows and columns, apply filters and sort orders, display calculated values and totals, and conveniently edit data in the grid cells.

Note: The Access Web Datasheet requires Office Access 2007 installed on the client computer and a browser that supports ActiveX controls.
The Access Web Datasheet task pane also contains several additional commands that make it easy to interact with Excel and Access.
| Command | Action |
| Track this list in Access | Creates a linked table in Access that also links to the Datasheet view, and that you can refresh and update (Only available in Office Access 2007). |
| Export to Access | Exports the view to a table in a database. |
| Report with Access | Creates a linked table in Access and generates a report. |
| Query list with Excel | Exports data to Excel that you can refresh in Excel. (Same behavior as the Export to Excel command available on the Actions menu in standard list view). |
| Print with Excel | Exports data to Excel so that you can print from Excel. |
| Chart with Excel | Exports data to Excel so that you can chart in Excel by using the Chart Wizard. |
| Create Excel PivotTable Report | Exports data to Excel so that you can create a PivotTable report in Excel. |
SharePoint libraries
A SharePoint library is a location on a SharePoint site where you can create, collect, update, and manage documents with team members and other employees. Each library displays a list of documents and key metadata about those documents, which helps people use the files and work together, and each library provides useful features such as checking documents in and out, creating major and minor version numbering and tracking, and using rich policy, auditing, and workflow features. You can create and manage documents, pictures, presentations, forms, and other types of files in a library. Finally, you can use the default Shared Documents library, customize this library for your purposes, or you can create your own additional libraries.
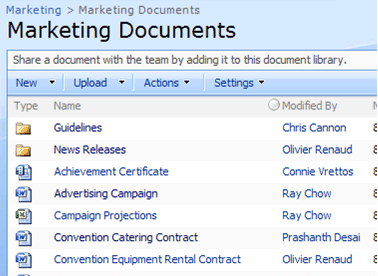
There are three types of libraries — Document Libraries, Form Libraries, and Data Connection Libraries — that can work with all types of data.
Document libraries You can use document libraries to store, access, and manage a wide variety of files including Office documents, spreadsheets, reports, forms, Office Access 2007 databases, and text files.
Form libraries You can store and work with Office InfoPath 2007 forms in form libraries. Form libraries provide a central location where users can fill out and store forms based on the same template. For example, you can use InfoPath to create an asset-tracking solution that stores the form template (.xsn) and the form XML files (.xml) in a SharePoint form library.
Data Connection Libraries A Data Connection Library (DCL) is a special library that can be defined as a trusted location and that makes it easy to store, secure, share, and manage ODC and UDC files. Administrators can control access to these connections so that only privileged, trusted users can use these connections. Excel Services can be set up so that only trusted connections can be used. An administrator may also need to move a database from a test server to a production server, or update a query that accesses the data. By using one ODC file saved in a DCL, administration of this connection information is much easier and the user's access to data is more convenient because all workbooks use the same connection file and a refresh operation, whether on the client or server computer, gets up-to-date changes to that connection file. You can even set up Office SharePoint Server 2007 and a user's client computer to automatically detect changes to the connection file and use the most up-to-date version of that connection file. In short, Data Connection Libraries greatly simplify the maintenance and management of data connections.
Web Parts and Web Part Pages
A Web Part is a modular unit of information that forms the basic building block of a Web Part Page. You can add Web Parts to Web Part zones in a Web Part Page and then customize the individual Web Parts to create a unique page for your site users. A Web Part Page is a special type of Web page in which you can use Web Parts to consolidate data, such as lists and charts, and Web content, such as text and images, into a dynamic information display that is built around a common task or special interest.
You can use a Web Part Page to present a variety of structured and unstructured information in an organized, useful, and convenient way. Web Part Pages often contain several Web Parts that are connected so that you can dynamically display data and content to see the results that you want.
For example, you can create a Web Part Page called Customer Orders that you use to display critical information. You get a call from a customer who has a question about an order, does not remember the order ID number, but does remember the date when the order was placed. You can use a Web Part Page to do the following.
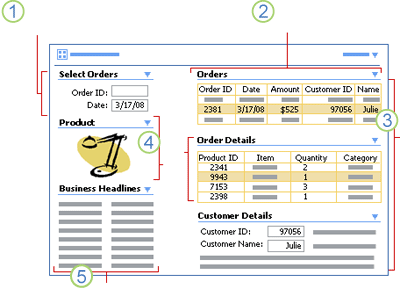
1. Look up an order by order ID number or, in this case, the order date.
2. Display all orders by date.
3. Select the correct order, based on the customer's name, and look up the order details as well as the customer details.
4. Select a line item in the order (in this case, the lamp), and display a product picture to confirm the customer's question.
5. Scan for late-breaking business news that is pertinent to the customer's order.
You can use Web Part Pages to:
-
Consolidate data from different data sources and create a report.
-
Analyze and aggregate data (for example, sums, totals, or counts).
-
Summarize key KPI information that you want to see at the beginning of each day.
-
Prioritize and highlight project or customer data in a dashboard to help you make effective decisions.
-
Display an up-to-date work schedule and meeting information to quickly plan your day.
-
Get quick access to business news, local weather, and your favorite Web sites to focus your Web browsing.
The following are key Web Parts that can be connected and that display structured and semi-structured data.
| Web Part | Description |
| List View | Displays list data and library metadata |
| Form | Displays data by using HTML form controls |
| Image | Displays images |
| Excel Web Access | Displays Excel workbooks |
| Report Viewer | Displays reports created from SQL Server Report Services |
| Data View | Displays and edits data from a variety of data sources |
| KPI | Displays key performance indicator (KPI) data and symbols from a KPI list |
| KPI Details | Displays KPI data for one item and symbols from a KPI list |
| Business Data Item | Displays details about a single item of business data |
| Business Data List | Displays a summary of business data in a list |
| Business Data Actions | Connects Web Parts to configure business application actions |
| Business Data Related List | Connects Web Parts to display related business items |
| Business Data Item Builder | Creates a business data item from parameters in a query string for use in business data profile pages. |
| Filter | Filters Web Part data in a variety of ways |
More information
| — | |
The Business Data Catalog
The Business Data Catalog (BDC) is a component that provides built-in support for displaying data from line-of-business (LOB) databases such as SAP, Siebel, and SQL Server. Typically, these LOB systems manage critical business information and processes such as customer data, inventory, billings, and product lifecycles. Often these systems require extensive training, are difficult to use, and are only available to a select few. The BDC makes this LOB data available to more people who need access to the data and who need to work with it in different, more flexible ways. For example, an InfoPath purchase order form could be used to display customer data from one system, product details from another system, and financial details from a third system.
The following is a summary of roles and tasks for working with the Business Data Catalog.
| Role | Task |
| Business analyst | Defines features and creates predefined solutions |
| Metadata author | Authors and tests metadata |
| Administrator | Imports the application definition and configures access to data |
| Site member | Incorporates business data into Web Parts, pages, and lists |
| Developer | Creates customized Web Part Page solutions |
| Site visitor | Consumes business data |
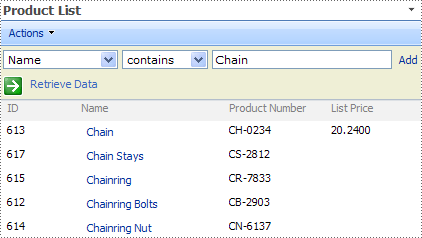
Once you extract the business data from the data source, there are four Business Data Catalog features you can use:
-
Business data in lists You can incorporate business data into any existing SharePoint list or document library by adding a business data column as a field type. Common scenarios include: associating documents with customer records, such as proposals, contracts, and presentations; supplementing data with custom columns, such as an annotation; and selecting data from a list, such as postal codes.
-
Business data actions Business data actions are links that appear beside business objects. These links can, for example, open Web pages, display the user interfaces of business applications, or open InfoPath forms. Business data actions also appear as links in SharePoint lists and search results. By using these links, you can easily update an item or see related data.
-
Business data Web Parts Office SharePoint Server 2007 includes several business data Web Parts that can display any entity from the BDC. You can use business data Web Parts to customize how business data is displayed on your site. You can also connect these Web Parts so that when you perform an action in one Web Part, it changes the contents of another Web Part.
-
Business data in user profiles To enhance the user information in Office SharePoint Server 2007, business data profiles are created by default when an application is registered in the BDC.
More information
| — | |
| — | |
KPI lists
 An out-of-the box list makes it much easier to incorporate KPIs into your business solutions. There are four ways to use a KPI list, each of which addresses a common source of KPI values and way to incorporate these values into a SharePoint site:
-
Data in SharePoint lists When SharePoint lists contain items that you can count, items that are part of a workflow, or items that contain dates, you can use a KPI to track how long the issues or tasks have been open, how many are open, and what percentage of a task is complete. You can also keep track of totals, such as the amount of time that an issue has been open or the total number of sales in a region.
-
Data in Excel workbooks You can set up a KPI in an Excel workbook in a document library and link to the KPI from Office SharePoint Server 2007. As the data in the workbook changes, the KPI is automatically updated. You can also choose to have the workbook displayed on the same Web page by using the Office Excel Web Access Web Part.
-
Data from Microsoft SQL Server 2005 Analysis Services Office SharePoint Server 2007 can use KPIs from Analysis Services, a component of Microsoft SQL Server 2005. A systems administrator or database analyst usually sets up these KPIs and registers the data connection with Office SharePoint Server 2007. Then, anyone with the appropriate permissions can access the database and link to the Analysis Services KPIs.
-
Manually entered information In situations where there is no formal system set up or you have a one-time project to track, you can enter the criteria manually. This KPI list is useful for displaying information that is communicated in e-mail or some other system.
More information
| — | |
Workflows
 Many vital processes in any organization depend largely on people. Automating interactions among the people who participate in a process can improve its efficiency. These processes are sometimes called human workflows. With Office SharePoint Server 2007 you can use the predefined workflows, or with Office SharePoint Designer 2007 you can create new workflow solutions based on list and library items. In Office SharePoint Designer 2007, a rules-based Workflow Designer makes it easy to construct workflows with conditional branching and multiple steps.
The workflows included with Office SharePoint Server 2007 offer close integration with the programs in the 2007 Office release. You can use Office Outlook 2007 to communicate tasks and status with users. You can use Office Access 2007 to modify the workflow associated with a linked list and create workflow reports to better evaluate the project's status and assess your business processes. Workflows can use custom forms created with Office InfoPath 2007 to interact with users through other Office programs, such as Office Word 2007.
More information
| — | |
| — | Demo: Streamline business processes with forms and workflows |
SQL Server Reporting Services
SQL Server Reporting Services is a complete, enterprise-wide report management and distribution service that includes report designing, building, delivery, security, and display in a variety of formats. With SQL Server 2005 Service Pack 2, you can use reporting services in SharePoint Integration Mode so that you can:
-
Use SharePoint libraries to store reports, data sources, and report models. Storing reports in document libraries enables a report to also use standard Office SharePoint Server 2007 features, such as workflow, versioning, and security. You can also add reports to the Report Center.
-
Synchronize reports and all associated resources stored within Office SharePoint Server 2007 with the same reports that are stored and executed from the report server.
-
Use a consistent user interface for managing and viewing reports. A convenient toolbar on the Report Viewer Web Part that lets you view and edit properties; manage permissions and subscriptions; edit in Report Builder; configure data sources, parameters, snapshots, and timeouts; view report and version Histories; and publish major versions.

You can use the Report Viewer Web Part to view, navigate, print, and export reports on a report server. The Report Viewer Web Part is associated with report definition (.rdl) files that are processed by a report server. You can set properties on the Web Part to control the appearance of the toolbar and view areas, and to link the Web Part to a specific report. Reports in a report library are rendered using a Report Viewer Web Part. Any Web Part Page can also be modified to display reports by using the Report Viewer Web Part and you can also connect to the filter Web Parts to limit the data displayed in reports.
Integrating Reporting Services with SharePoint Server requires these components to be installed: SQL Server 2005 Reporting Services, which hosts Reporting Services reports and communicates with SharePoint Server using a Web Services interface; SQL Server 2005 Service Pack 2, which enables SharePoint Server and Reporting Services integration on the report server; and Microsoft SQL Server 2005 Reporting Services Add-in for Microsoft SharePoint Technologies, which includes the Report Viewer Web Part and the new report management user interface.
The Report Center
A Report Center is a site template that contains a predefined collection of report libraries, Data Connection Libraries, SharePoint lists, Web Parts including filter Web Parts, and KPIs that you can customize and enhance for your own purpose. Think of the Report Center as a central hub that provides a common, simple, and secure location and reporting environment for users to navigate to, locate, and get up-to-date reports, whether for ad hoc querying or scheduled, periodic snapshots. By using the Report Center, you can reduce reliance on e-mail attachments for the delivery of reports and help clear up network congestion. You can store a variety of reports in the Report Center including, spreadsheets, Access snapshots, SQL Report Services reports, and PDF files.

More information
| — | ||
| — | ||
Using data from Office system programs with Office SharePoint Server 2007
Of course, you can create a business solution that uses all types of data just by using Office SharePoint Server 2007. However, the 2007 Office release has many useful integration points with Office SharePoint Server 2007 that make it easier to work with structured and semi-structured data, and can make your business solution that much more effective and well-designed. In the hands of a capable information worker, your "contractor," the following 2007 Office release programs act as the "architects" of a well-designed and satisfactory business solution.
| Program | Purpose | Type of Data |
| Excel (along with the Excel Services technology) | Analyze and visualize numerical and other data in a spreadsheet format, create professional-looking charts, and work with hierarchical data by using PivotTable reports. | Structured |
| InfoPath | Gather and process XML-based data. | Structured and semi-structured |
| Access | Consolidate, enter, store, report, and manage data in a database.. | Structured and semi-structured |
| SharePoint Designer | Customize data-driven Web pages and SharePoint sites, and create Data Views. | Structured, semi-structured, and unstructured |
| Word | Author professional documents quickly and efficiently | Unstructured |
| Visio | Visualize and communicate complex information, systems, and processes. | Unstructured |
| Outlook | Communicate through e-mail, and manage contacts, schedules and tasks. | Unstructured |
| Publisher | Create professional looking publications and marketing material. | Unstructured |
| PowerPoint | Create dynamic presentations using animation, graphics, and media. | Unstructured |
Excel and Excel Services
Use Excel and Excel Services when you want to:
-
Run calculations and statistical comparisons on your data.
-
Create and use PivotTable reports to view hierarchical data in a compact and flexible layout.
-
Visually emphasize your data by using professional-looking charts, conditional formatting icons, data bars, and color scales.
-
Perform sophisticated what-if analysis operations on your data, such as statistical, engineering, and regression analysis.
Excel provides the following data-focused integration points with Office SharePoint Server 2007.
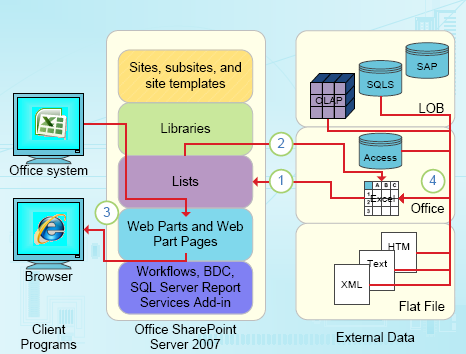
1. Do a one-time import of Excel worksheet data into a SharePoint list, or export Excel worksheet data to a SharePoint list to create a permanent, one-way data connection.
2. Use the permanent, one-way data connection to refresh data in an Excel worksheet from the SharePoint list.
3. Publish Excel workbooks to Excel Services, and display and interact with data by using the Office Excel Web Access Web Part on a Web Part Page.
4. Import data into an Excel workbook from OLAP servers, SQL Server and Access databases, and flat files.
Import Excel data into a SharePoint list
If you want to load existing data into a SharePoint list, you can import the data from an Excel worksheet, a range of cells, a named range, or an Excel table into a SharePoint list by using the Import command on the Actions menu of a SharePoint list.
Export SharePoint List data into an Excel Table
You can export SharePoint List data into an Excel Table, which creates a one-way data connection between Excel and the SharePoint list. When you update your data from the SharePoint list and refresh the data in Excel, Excel replaces the Excel data with the latest SharePoint list data, overwriting any changes that you made to that data. Because the data connection is one-way only, changes that you made in Excel are not reflected in the list on the SharePoint site.
Note: You cannot synchronize data between an Office Excel 2007 workbook and a SharePoint list. This functionality was available in Microsoft Excel 2003 and is still available by using an Excel 2003 workbook or Visual Basic for Applications (VBA). However, Office Access 2007 is now the preferred method of synchronizing data between an Office program and a SharePoint list with a two-way connection.
Export an Excel table to a SharePoint List
When you export table data from Excel to a SharePoint list by using the Export Table to SharePoint List Wizard, you are using another way to create a one-way data connection between Excel and the SharePoint list.
If you don't want to keep the table data in the Excel worksheet updated with changes that are made to the SharePoint list, you can also export the data without a connection to the SharePoint list.
Publish to Excel Services
You can publish a workbook to Office SharePoint Server 2007 so that other users can access all or parts of the data that it contains by using the Office Excel Web Access Web Part. When you publish a workbook to Excel Services, the entire workbook is published on the server, but you can define the parts of the workbook (such as individual worksheets, named ranges, or charts) that you want Excel Services to display in the Office Excel Web Access Web Part. By displaying only specific parts of the workbook and by using Office SharePoint Server 2007 permissions to help protect the workbook from unauthorized access, you can keep data in the workbook confidential while enabling authorized users to refresh, recalculate, and interact with the viewable data. If you set parameters for named cells in the workbook before you publish it, the users can also edit those cells and define values.
Other users can view and analyze the worksheet data that is shown. They can interact with it by using some Excel functionality, such as sorting and filtering data, or by using PivotTable drill-down features. If you set parameters for named cells in the workbook, the users can also edit those cells and define values.
 1. The top section contains the title and a toolbar which has several menus, commands, and a drop-down list.
2. The main window displays one or more worksheets in Worksheet view, a named item, such as a chart or an Excel table in Named Item view, and optionally an outline area.
3. The Parameters task pane has parameter labels, text boxes for data entry, and optional tool tips that provide more information about each parameter.
4. The bottom section displays refresh data messages.
Note: Not all Excel features are supported by Excel Services.
More information
| — | |
| — | |
| — | |
| — | |
InfoPath
Use InfoPath when you want to:
-
Collect business data on a regular basis, including expense reports, time cards, surveys, and insurance forms.
-
Design simple to sophisticated electronic forms by using standard controls, such as text boxes and list boxes, and flexible controls such as repeating tables, choice groups, optional sections, and multiple views.
-
Ensure consistent, accurate data.
-
Create a report by merging forms into a single form.
InfoPath provides the following data-focused integration points with Office SharePoint Server 2007.

1. Publish form templates to form libraries as templates and as content types.
2. Read and write form XML files stored in form libraries.
3. Using XML form files, read data from lists and Excel worksheets, and read and write data from SQL Server and Access databases.
4. Enable editing list view data based on form properties.
5. Display InfoPath forms in a browser by using browser-compatible form templates.
Submit data to a SharePoint site and populate form controls with SharePoint data
To allow users to submit forms that are based on your form template to a document library, you can add a secondary data connection to your form template that submits the data. After you add the submit data connection, you can configure the form template to allow your users to submit their form data to the document library.
Publish a form template to a Form library
You can publish a form template to Office SharePoint Server 2007, and store and work with Office InfoPath 2007 forms in a form library. A form library provides a central location where users can fill out and store forms based on the same template. For example, you can use InfoPath to create an asset-tracking solution that stores the form template (.xsn) and the form XML files (.xml) in a form library.
Create and use browser-enabled forms
When you design an Office InfoPath 2007 form template, you can choose to create a form template that can be opened or filled out in a Web browser. This type of form template is called a browser-compatible form template. After you finish designing a browser-compatible form template, you use the Publishing Wizard to publish it to a server running InfoPath Forms Services.
Publish a form template as a site content type
When you publish a form template as a site content type, you enable users to assign multiple form templates to a single document library or to assign the form template to multiple libraries across a site collection. A site collection is a set of Web sites on a virtual server that have the same owner and share the administration settings. Each site collection contains a top-level Web site and can contain one or more subsites. There can be multiple site collections on each virtual server. Use a site content type when you want to widely reuse information or to enable the collection of data from many forms in a single place.
Enable users to edit fields by using a list view
You can allow your users to add or edit data for a field by using a list view or by editing the properties for a form in the form library. This enables users to use a SharePoint list to add or update data for one or more forms without actually opening the forms.
Access
Use Access when you need to:
-
Share data in a relational database.
-
Handle updates efficiently by using record locking and conflict resolution features.
-
Work with many tables.
-
Create complex queries to join the tables together.
-
Create forms and reports.
Access provides the following data-focused integration points with Office SharePoint Server 2007.
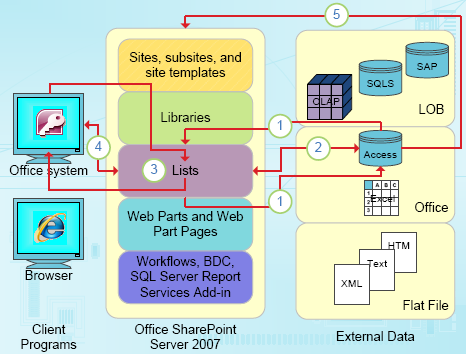
1. Do a one-time import or export of data between Access views and a SharePoint list.
2. Link data between Access tables and a SharePoint list by creating a permanent two-way connection (Updated list data can be in seen in an Access table; updated Access table data can be seen in a list).
3. Take list data offline, update in Access, bring back online, synchronize updates, and resolve conflicts.
4. Display and edit list data in Access datasheet, form, and report views.
5. Publish Access databases to Office SharePoint Server 2007.
New SharePoint list integration features in Office Access 2007
The following new features in Office Access 2007 make Office SharePoint Server 2007 integration easier and more flexible:
-
Enhanced mapping of SharePoint data types With new support for multi-valued fields and attachments, Office Access 2007 now supports more of the data types found on SharePoint sites, making the design and building of shared applications much simpler.
-
Tracking the history of Memo fields Memo fields are useful for storing large amounts of information. You can set a property that enables Office Access 2007 to retain a history of all changes to a Memo field. You can then view a history of those changes. This feature also supports the versioning feature on SharePoint sites, so that you can also use Office Access 2007 to view the changes that were made to the SharePoint list.
-
Lookup tables When you link to a SharePoint list, Office Access 2007 automatically creates linked tables for all lookup lists (unless the lookup lists are already linked to the database). If the lookup lists contain columns that look up other lists, those lists are also included in the linking operation, so that the lookup list of every linked table has a corresponding linked table in the database. Access also creates relationships between these linked tables.
Import and export data to a SharePoint list
You can bring a SharePoint list into Office Access 2007 by importing it. Importing a SharePoint list creates a copy of the list in an Office Access 2007 database.
When you export data, Office Access 2007 creates a copy of the selected table or query database object, and stores the copy as a list. For example, you may want to share data between Office Access 2007 and a SharePoint site on an ongoing basis, but the data is currently stored in Access. You use queries in an Office Access 2007 database to generate daily or weekly status reports, and then you post the results to one of your SharePoint sites at regular intervals.
Link to a SharePoint list
Linking lets you connect to data in a list without importing that information, so that you create a two-way connection to view and edit the latest data both in the list and your Office Access 2007 database. When you link to a SharePoint list, Office Access 2007 creates a linked table that reflects the structure and contents of the source list. Unlike importing, linking creates a link only to the list, not to any specific views of the list. However, if you want to make structural changes, such as removing or changing a column, you must open the list on the SharePoint site. You also cannot add, delete, or modify the fields in a linked table while working in Office Access 2007.
Take linked SharePoint lists offline with Office Access 2007
If you need to take some work home with you or on the road, you can take your linked SharePoint lists offline with one click by using Office Access 2007. You can work on your data in Office Access 2007 and then synchronize your changes or reconnect with the SharePoint site at a later time. For example, perhaps you need to provide a parts catalog to a client while you are on the road. If you have linked your SharePoint lists to Office Access 2007 tables, you can take your data offline and eventually bring it back online. If conflicts occur — for example, if someone else updates the same record on the server or while that person also is working offline — you can resolve the conflict when you synchronize.
Open Office Access 2007 forms and reports from a SharePoint site
You can open lists in rich Office Access 2007 views from a SharePoint site. Office Access 2007 forms, reports, and datasheets can appear alongside other views on a SharePoint site. When you choose a view, Office Access 2007 starts and opens the requested form, report, or datasheet. This makes it easy for you to run a rich report on a SharePoint site without having to first start Office Access 2007 or navigate to the right object.
Note: A user needs Office Access 2007 installed on his or her computer to create, use, or modify an Office Access 2007 view on a SharePoint site.
Publish an Office Access 2007 database to a SharePoint site
You can publish (also called moving and upsizing) your Office Access 2007 database to Office SharePoint Server 2007. When you publish a database from Office Access 2007 to a SharePoint site, you create lists on the SharePoint site that are linked as tables in your database. When a database is moved, Office Access 2007 creates a new front-end application that has all the old forms and reports and the new linked tables that were just exported. The Move to SharePoint Site Wizard helps you to move the data from all your tables at the same time. Optionally, the Office Access 2007 database can then be loaded into a SharePoint document library.
For example, you can use the Access Tracking template that interacts directly with the Issue Tracking template on a SharePoint site to track your organization's data, issues, and workflow. When people work with these lists on a SharePoint site, they can open the Office Access 2007 queries and reports from the View menu for the SharePoint lists. If you want to view and print an Access issues report for a monthly meeting, you can do it directly from the SharePoint list.
After the SharePoint lists are created, people can work with the lists on the SharePoint site or in the linked tables in Office Access 2007 while they use the features of a SharePoint site to manage the data and stay updated with changes. As an administrator, you can manage permission to the data and versions of the data so that you can see who changed it or restore previous data.
SharePoint Designer
Use Office SharePoint Designer 2007 when you want to:
-
Create and customize Web sites.
-
Design workflows without having to use traditional procedural coding languages or techniques.
-
Create a customized view of live data by designing a Data View.
-
Create a form that writes back to data sources by inserting a Data View as a form.
Office SharePoint Designer 2007 provides the following data-focused integration points with Office SharePoint Server 2007.
1. Create Data Views by using Office SharePoint Designer 2007.
2. Read, combine, and update data from many different data sources in a Data View, which is a Web Part that you can only create in Office SharePoint Designer 2007.
3. Display and edit data in Data Views on Web pages.
Data Views
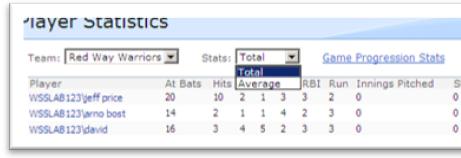
A Data View is a live, customizable view of a data source in the form of Extensible Markup Language (XML) and displays that data by using Extensible Stylesheet Language Transformations (XSLTs) By using a Data View you can:
-
Display and edit data from a wide variety of data sources, including database queries, XML documents, and SharePoint lists and libraries, and compile data from multiple data sources to create flexible, customized views and reports.
-
Present live views of data that you can filter, sort, or group, and build conditional views.
-
Build Web Part pages and connect Web Parts to create business solutions.
-
Create rich custom forms.
More information
| — | |
Other Office system programs
Although the other Office system programs are not data-centric, there are additional ways to incorporate structured and semi-structured data into a solution that uses these other programs.
Visio data diagrams
You can display a Visio diagram on a Web Page by using Microsoft Visio Viewer or by saving the diagram as a Web Page. A diagram can help you visualize, organize, understand, and present data stored in lists, workbooks or databases, in Visio shapes by using a data link. For example, you can show sales data for a different region, so it is easy to compare sales results region to region, both for the current and previous years.

Mail merge
 You can use Word, Publisher, and Outlook to create a mass mailing solution by using mail merge to create personalized letters, envelopes, labels, and e-mail messages to customers or clients. For example, you could store a Word or Publisher document in a SharePoint library and use the Contacts list (among many other possible data sources) as the data source for the mail merge operation. You could even use a workflow to "kick off" a mail merge as part of a marketing campaign targeting specific customers.
Document Information Panels in Word, PowerPoint, and Excel
Simple keyword searches often are not precise enough to fulfill requests for business records associated with certain projects, business entities, or accounts. The Document Information Panel is available in these 2007 Office release programs: Word, Excel, and PowerPoint. The Document Information Panel is a metadata capture mechanism that is easy to configure without writing program code. The Document Information Panel collects and retrieves metadata to give context to the document and increase the ability to search for it throughout a SharePoint site.
 Because the Document Information Panel is an XML form, it is fully customizable by using InfoPath. With the data connection capabilities of InfoPath, you can even create a Document Information Panel that brings LOB data into the form. For example, you could populate customer data fields with data from a customer records management (CRM) system. Before closing the document, the user would then add in any important document information such as links to related documents. Metadata is thus captured in a much more convenient manner and is easily associated with a set of customers, products, and related documents.
More information
| — | Introduction to designing a Document Information Panel by using InfoPath |
| — | |
| — | |
Outlook 2007 tasks and contacts
Outlook has many integration points with Office SharePoint Server 2007. You can send an e-mail by using a SharePoint Contacts list, display SharePoint and Outlook 2007 calendars side by side, manage SharePoint alerts and RSS feeds, create a meeting workspace, and use a workflow. You can also take document libraries offline, bring them back online, and synchronize them by using Outlook 2007. Two additional data-focused integration points involve using structured data.
You can work with both standard tasks lists and project tasks lists by taking task lists offline, bringing them back online, and synchronizing them; viewing, updating, and adding new tasks to the SharePoint site without leaving Outlook; and creating and assigning tasks to team members.
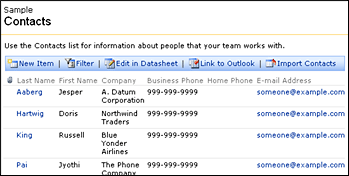 You can also store, share, and manage SharePoint contacts more efficiently in Outlook. Once you are connected to Outlook 2007, the SharePoint contacts work just like your personal Outlook contacts. You can view, edit, print, and even telephone these contacts by using Microsoft Office Communicator. You can send them e-mail messages and meeting requests, use color categories, store multiple phone numbers and e-mail addresses, and include contact photos, Electronic Business Cards, as well as birthday and anniversary information. You can even use a Contacts Web Part to display Outlook contacts on a Web Part Page.
Get started with templates and scenarios
To help you get that much closer to your business solution, Microsoft provides a variety of "out-of-the-box" templates that help you quickly build common solutions. The following sections describe useful templates, which are predefined documents or sites with functionality, styles, and layouts that address common needs, and typical scenarios, which are descriptions of business solutions that may be similar to your solution needs. Templates and scenarios are your "pre-designed architectural styles and floor plans" that help you pick the best design for your business solution needs.
Use these templates and scenarios as a starting point to customize and create your own business solutions. Use Office SharePoint Designer 2007 to add or modify views on data in the SharePoint site, customize the master page of your SharePoint site to conform to your site standards, as well as integrate external data from your data sources. Add to or customize existing business logic to better suit your organization's processes and workflows. Use the BDC to integrate your LOB data into the business solution. Take advantage of the many data-focused integration points offered by Access, InfoPath, and Excel to further enhance these templates and scenarios the way you want. The possibilities are endless.
SharePoint site templates
Microsoft provides site templates that provide out-of-the-box custom scenarios tailored to address the needs and requirements of specific business processes or sets of tasks in organizations of any size. These site templates are based on Windows SharePoint Services 3.0 and are compatible with Office SharePoint Designer 2007 to help make customization easier.
Management and Finance templates
Board of Directors Provide a single location for board meeting notes, tasks and issues, and events.
Business Performance Reporting Help track customer satisfaction through surveys and online discussions.
Compliance Process Support Site Help both teams and executive sponsors manage compliance implementation endeavors by specifying control tasks and managing document libraries.
Disputed Invoice Management Help accounts payable departments track information regarding invoices due to vendors, including value of early payment and reasons for delayed payment.
Expense Reimbursement and Approval Manage elements of the expense approval process, helping to save time for approvers.
Request for Proposal Help manage the process of creating and releasing Request For Proposals (RFP) as well as the collecting proposal submissions and acceptance notification.
Human Resources
Absence Request and Vacation Schedule Management Help employees manage requests for out-of-office days, including listing days they will be unavailable who will cover their responsibilities while they are gone.
Employees Activities Site Help employees create and sign up for activities and events sponsored by the company.
Employee Self-Service Benefits Enable employees to locate and sign up for benefits offered by their employer.
Employee Training Scheduling and Materials Help schedule training as well as provide a location for employees to sign up and receive course material.
Job Requisition and Interview Management Enable your recruiting team to streamline the process of managing job requisitions and filling job openings.
IT and Operations
Bug Database Help development teams collect and track information about bugs in their code including reproduction steps, category, comments, priority, and severity of the bug.
Call Center Help individuals manage the process of handling customer service requests from issue identification to cause analysis and resolution.
Help Desk Help teams manage the process of handling service requests, including managing identification of the root cause and tracking status.
Inventory Tracking Help organizations track elements associated with inventory by capturing manual input of updated inventory information and notifying users when each part reaches the reorder quantity.
IT Team Workspace Help teams manage the development, deployment, and support of software projects by updating project tasks, issues, milestones, and bugs.
Lending Library Help manage the physical assets in an organization's library with check out / in functionality and automated overdue notification.
Physical Asset Tracking and Management Help teams manage requests and tracking of physical assets such as location, condition, manufacturer, model, current owner, and estimated value.
Room and Equipment Reservations Enable teams to manage the utilization of shared meeting rooms and equipment.
Tracking and Management
Budgeting and Tracking Multiple Projects Help track and budget multiple, interrelated sets of activities with project creation, tasks, Gantt charts, and common status designator tools.
Change Request Management Help users track risks associated with a design change, including the ability to approve or reject the change.
Discussion Database Foster collaboration by helping teams discuss topics online or through Office Outlook 2007 RSS capabilities.
Document Library and Review Help teams manage the document review cycle with a version-tracking document library including a threaded discussion to provide a feedback.
Knowledge Base Enable employees to share knowledge resident within their organization.
Project Tracking Workspace Help small teams manage project information such as project issues, tasks, and project status.
Team Work Site Enable project teams to centrally store background documents, track calendar events, and submit action items that result from team meetings.
Timecard Management Help simplify the process of tracking hours spent on multiple projects through employee "punch-in / punch-out" capabilities and reporting of work in progress and project hours worked to date.
Sales and Marketing
Competitive Analysis Site Help organize the results of competitors' offerings through useful competitive analysis technique templates.
Contacts Management Help teams manage contact information among team members, including synchronization with Office Outlook 2007.
Integrated Marketing Campaign Tracking Enable tracking of marketing campaign performance.
Product and Marketing Requirements Planning Help organize the process of developing new products and marketing content through useful planning templates and collaboration tools.
Sales Lead Pipeline Help teams manage the sales pipeline by tracking leads, opportunities, contacts, and accounts.
Specialty
Sports League Manage a company baseball league, including players, captains, schedule, and statistics.
Classroom Management Help instructors store and organize course content, calendar items, and announcements.
Equity Research Provides a centralized location to help consolidate the research done to evaluate financial equities.
Case Management for Government Agencies Help manage tasks, documents, and assignments related to government cases.
Clinical Trial Initiation and Management Help manage the documents, tasks, issues, and discussions needed to run a clinical trial.
Manufacturing Process Management Help enable manufacturing engineering teams track the linear manufacturing process, as well as issues that are blocking completion of a manufacturing task.
Event Planning Help teams organize events through the use online registration, schedules, communication, and feedback.
New Store Opening Help teams manage the process of opening a new store, including project and task-management tools.
More information
| — | |
| — | |
SharePoint workflows
Office SharePoint Server 2007 includes the following predefined workflows that you can use to automate a business process for or for use in common workgroup situations.
Approval Workflow The Approval workflow routes a document or item that is saved to a list or library to a group of people for approval. By default, the Approval workflow is associated with the Document content type and it is thus automatically available in document libraries.
Collect Feedback Workflow The Collect Feedback workflow routes a document or item that is saved to a list or library to a group of people to collect their review feedback. By default, the Collect Feedback workflow is associated with the Document content type and it is thus automatically available in document libraries.
Collect Signatures Workflow The Collect Signatures workflow routes an Office document that is saved to a list or library to a group of people to collect their digital signatures. The Collect Signatures workflow works only with Office Word 2007 or Office Excel 2007 documents that contain one or more signature lines. By default, the Collect Signatures workflow is associated with the Document content type and it is thus automatically available in document libraries for documents or workbooks that contain signature lines.
Disposition Approval Workflow The Disposition Approval workflow is designed to support records management needs within an organization. This workflow manages the document expiration and retention process by allowing participants to decide whether to retain or delete expired documents or items.
Translation Management Workflow The Translation Management workflow creates and routes copies of a source document in a Translation Management library to designated translators for translation. The Translation Management workflow is available only for Translation Management libraries.
Purchase order approval scenario A common business process is a purchase-order approval process which could combine four default workflows:
-
Review current budget status (Collect Feedback workflow)
-
Verify inventory (Disposition Approval workflow)
-
Get manager's approval if over approval limit (Collect Signatures workflow)
-
Approve purchase order (Approval workflow)
Send a notification message scenario Your team uses the Shared Documents library to collaborate on documents, and your team uses the Assigned To column to track whom documents are assigned to. Instead of having all members of the team continually checking the team site to see if they have documents newly assigned to them, you want to create a workflow that automatically sends an e-mail message to any team member when they receive an assignment. You can quickly do this by creating a one-step workflow.
Create a task from a discussion item Your team uses the Team Discussion list to work on issues and problems that the team must address. Often in the course of discussion, an issue or work item arises that a team member must follow up on. You want to be able to easily create a task item from a team discussion item. You decide to create a workflow so that your team can simply click a button in the Team Discussion list to create a task in the Tasks list. The task created will automatically contain information from the related discussion item, and the task will automatically be assigned to the person who created the original discussion item.
Route an expense report for review Your team fills out monthly expense reports that are forms designed with Office InfoPath 2007. Your team fills out and stores these forms in a form library on your SharePoint site. When the expense report exceeds a certain amount, you want to automatically notify the appropriate person to review the report. You can quickly automate this process with a one-step workflow.
More information
| — | |
| — | |
| — | |
| — | |
| — | |
| — | |
| — | |
| — | |
Office system templates and scenarios
Office Online Templates is a great place to start when you're looking for Office templates, where you will find hundreds of templates for a wide variety of uses from Agendas to Zoos.
Although Excel 2007, Excel Services, Access 2007, and InfoPath 2007 can be used in many ways to solve many problems, the following templates and scenarios address common business solutions and can be adapted for use with SharePoint Server.
Excel 2007 scenarios
Accounting You can use the powerful calculation features of Excel in many financial accounting statements, for example, a cash-flow statement, income statement, or profit and loss statement.
Budgeting Whether your needs are personal or business related, you can create any type of budget in Excel, for example, a marketing budget plan, an event budget, or a retirement budget.
Billing and sales Excel is also useful for managing billing and sales data, and you can easily create the forms that you need, for example, sales invoices, packing slips, or purchase orders.
Reporting You can create various types of reports in Excel that reflect your data analysis or summarize your data, for example, reports that measure project performance, forecast data, or present variance data.
Planning Excel is a great tool for creating professional plans or useful planners, for example, a weekly class plan, a marketing research plan, a year-end tax plan, or planners that help you plan weekly meals, parties, or vacations.
Excel Services scenarios
Business intelligence dashboards An executive committee has access to several company dashboards that act as an up-to-date financial scoreboard for the company. To continuously assess company performance, the main dashboard summarizes KPIs, such as sales goals, target revenues, and profit margins, on a monthly basis. Additional dashboards summarize market news to help analyze financial risk for current and new projects, and to display charts of critical financial data to help evaluate different investment portfolios.
Marketing analysis information system A marketing department in a company that sells athletic clothing and equipment maintains an information portal page that summarizes key demographic data, such as gender, age, region, income-level, and preferred leisure activity. Most employees in the marketing department can optionally open the Excel workbooks on their computer and do "what-if" analysis of all data, or print well-formatted reports. Over time, users can also easily add reports for others to share.
Professional sports players statistics A major league sports organization shares past and present statistics on all players' performance and salaries. This data is used to make trades and to negotiate salary contracts. New reports and analyses are created, revised, and shared by owners, especially during the preseason.
Retail store decision-making tool A retail chain summarizes critical point-of-sales data on a weekly basis and shares it with suppliers, financial analysts, and regional managers. Reports include current items below inventory, top 20 selling items by sales categories, important seasonal data, and transaction counts by each store.
Sales account management report system A sales group accesses a set of daily briefing reports that capture key data such as the top sales people, progress towards monthly sales targets, successful sales programs, and low-performing channels of distribution. Additional reports summarize sales by key variables, such as region, product line, and month, sales calls per week, and the number of closed calls. When individual sales people display these reports, they can automatically see their sales numbers because the system identifies them based on their user name.
Engineering project daily summary An engineering group develops a Web Part Page that summarizes key project schedule data such as bug counts, status of specifications, progress diagrams, feature trends and priorities, and links to key resources and contacts. The data is drawn from several external data sources, such as project databases and lists of specifications.
Proprietary financial analysis calculation model A large financial institution has researched and developed a pricing model that is private intellectual property. The results of the formula need to be shared with some investment managers, but the formula that is used to calculate the pricing model must be secure and never be publicly revealed. This pricing model is extremely complex and takes a long time to calculate. Every night, the pricing model report is calculated and created on a fast server, saved to a trusted location, and displayed on a Web Part Page, but only to those who have appropriate permission.
Access 2007 templates
Assets Create an assets database to keep track of assets, including asset details and owners. You can place assets into categories and record their condition, acquired date, location, owner and more.
Managing contacts You can manage your contacts and mailing addresses, and then create reports in Access or merge the data with Word to print form letters, envelopes, or mailing labels. Create a contacts database to manage information about people that your team works with, such as customers and partners. You can track name and address information, phone numbers, e-mail addresses, and even attach a picture.
Inventory and asset tracking You can create an inventory of items in your home or business, and store photos or other related documents along with the data.
Order tracking You can enter information about products, customers, and orders, and then create reports that show sales by employee, region, time period, or some other value.
Task, issues, and project tracking You can track tasks for a group of people, and enter new tasks at the same time others are updating their existing tasks in the same database. Track a group of work items that you or your team needs to complete. Create an issues database to manage a set of issues or problems. You can assign, prioritize, and follow the progress of issues from start to finish. Manage tasks and keep an eye on the budget for one or more projects.
Marketing projects and sales pipeline Create a sales pipeline database to track the progress of prospective sales within a small group of sales professionals. Keep track of the details for a marketing project and schedule and monitor project deliverables.
Event planning You can enter information about event dates, locations, and participants, and then print schedules or summaries about the events. Create an events database when you want to track upcoming meetings, deadlines, and other important events. Record title, location, start time, end time, description and attach an image.
Faculty and students Create a database to track important information faculty information, such as telephone and address information, emergency contact information, and employment data. Create a students database to keep track of information about your students, including emergency contacts, medical information, and information about their guardians.
InfoPath 2007 templates and scenarios
Asset Tracking template Track the details and location of business assets, such as computer equipment.
Meeting Agenda template Organize and summarize a business meeting. Use this form template to list the agenda items, and to record meeting minutes, decisions, and action items.
Status Report template Track the progress and issues for a team member's projects and assignments. Individual status reports can be combined into a single report so that managers can create one, comprehensive status report for their team.
Travel Request template Request travel arrangements, such as flights and hotel accommodations, for a business trip.
Expense report template Fill out an expense report form with extensive built-in data validation business rules logic either online, or offline, which is especially useful for employees who travel frequently.
Insurance claims scenario Enable customers, insurance agents, and related businesses to use online forms to process their insurance claims. In addition to submitting claims by telephone, customers can submit claims by filling out a form on the Web. Use an integrated approval workflow to allow an agent to quickly see the status of the other parties working on the claim and to see whether the adjuster has completed the approval process.
Permit applications scenario Fill out permit applications in a Web browser, so that the permit process is easier and more convenient so contractors no longer have to travel to a government office to apply for a permit.
Inventory management scenario Easily and effectively query an extensive network of suppliers about inventory, and improve the accuracy of inventory estimates.
Market research scenario Help with market research activities by using a form template to collect and record customer feedback and ensure a consistent organization and formalization of information.
More information
| — | |
| — | |
| — | |
Microsoft Office Tutorials: Blueprint For Using Data In Sharepoint Server >>>>> Download Now
ReplyDelete>>>>> Download Full
Microsoft Office Tutorials: Blueprint For Using Data In Sharepoint Server >>>>> Download LINK
>>>>> Download Now
Microsoft Office Tutorials: Blueprint For Using Data In Sharepoint Server >>>>> Download Full
>>>>> Download LINK M5