Tuesday, July 31, 2018
Sort data by rows instead of columns
Sort data by rows instead of columns
In Excel Online, you can sort tables and ranges by columns, but you can't sort by rows (a left to right sort).
For news about the latest Excel Online updates, visit the Microsoft Excel blog.
For the full suite of Office applications and services, try or buy it at Office.com.
Video: Open files from the cloud in Word for iPad
Video: Open files from the cloud in Word for iPad

Word for iPad can open workbooks from OneDrive for Business (for your work or school stuff), OneDrive.com (for your personal stuff), or from a Dropbox account.
Other tutorial videos for Word for iPad:
-
Open files from the cloud. (You are here!) Open files from OneDrive for Business (for your work or school stuff), OneDrive.com (for your personal stuff), or from a Dropbox account.
-
Open email attachments. Open, edit, and send back email attachments using Word for iPad.
-
How saving works in Word for iPad. Word for iPad automatically saves your work every time you make even a small change. In most cases, you don't have to do anything at all to save your document. Watch this training video to learn about AutoSave.
-
Type in Word for iPad. Typing in Word for iPad can be tricky at first, especially if you're used to a physical keyboard. This training video shows you some typing tips for Word for iPad.
-
Select stuff in Word for iPad. Select text and pictures expertly with your finger in Word for iPad. This training video helps you move from the mouse to the touchscreen.
-
How to print in Word for iPad. You tap the File button to print in Word for iPad. Watch this video to learn how. At this time, you can only print to an AirPrint compatible printer.
Add a border to a slide
Add a border to a slide
You can add a border to a slide for an added element of design in your presentation. While there is not a specific tool in PowerPoint to add a border, there are a couple of ways to accomplish the task: create a simple border by using the outline of a shape, or use Bing Image Search to find and insert a border.
Create a simple border by using the outline of a shape
-
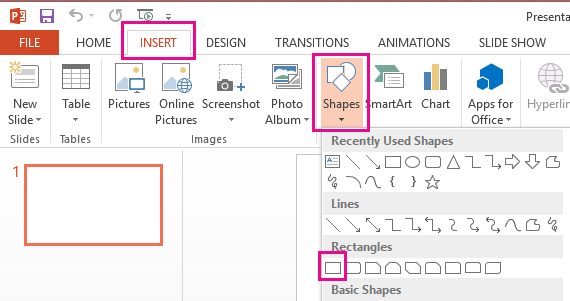
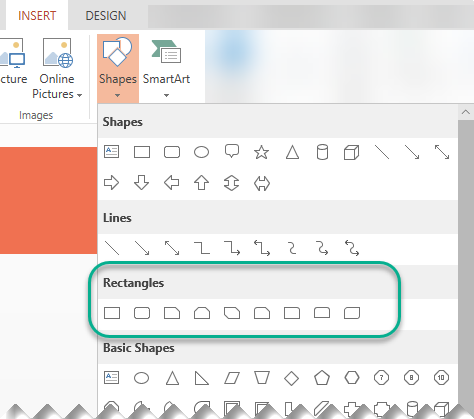
Click Insert, and click the Shapes drop-down menu.
-
Select a shape from the Rectangles category.
-
To draw the shape to the size you want, place the cursor at the top-left corner. Hold the left mouse button, and drag the cursor to the bottom right.
(The Format tab is available on the Ribbon after you select a shape by clicking it.)

-
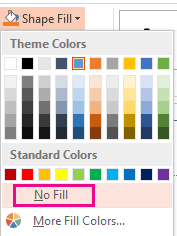
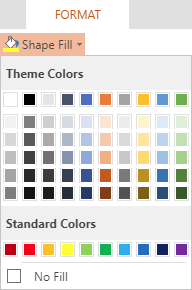
To eliminate the background color, click Format, and click the Shape Fill drop-down menu. Click No Fill.
-
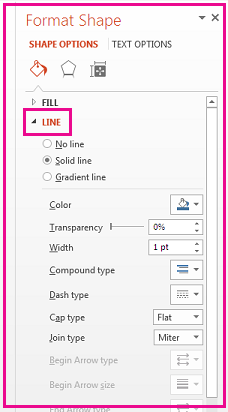
Optional. Right-click the border, and select Format Shape. Use the Format Shape panel on the right to adjust how the border line looks.

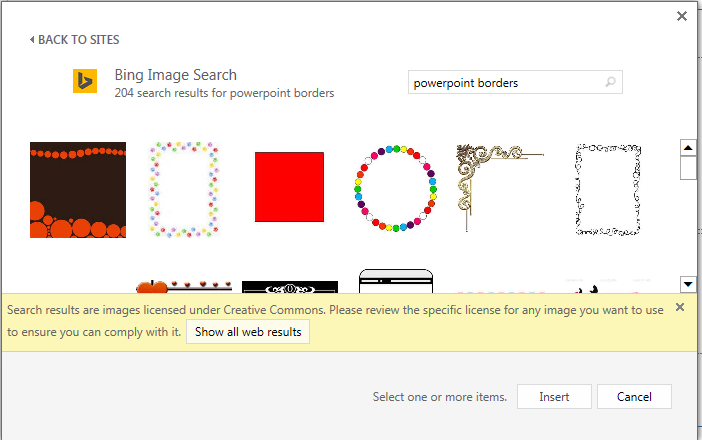
Use Bing Image Search to insert a border
You can also search for a new border to use in your presentation. PowerPoint uses a Bing Image Search to locate and download borders. You can search for new border images if you are connected to the Internet.
-
On the slide where you want to add a border, click Insert > Online Pictures.
-
Type a search phrase, like line borders or flower borders in the Bing Image Search box, and press Enter.
-
Select a border image, and click Insert to add it to your slide.
Note: The Bing Image Search results bring up images that are licensed under Creative Commons. For more information, see Add clip art to your file.
See also
Create a simple border by using the outline of a shape
-
On the Insert tab, in the Illustrations group, click the arrow under Shapes.
-
Under Recently Used Shapes, click a rectangle shape.
-
On your slide, drag to a draw a rectangle that is almost as large as the slide.
-
Right-click the rectangle, click Format Shape, and then do the following:
-
To remove the background color of the rectangle, in the Format Shape box, click Fill in the left pane. and then click No fill.
-
To change the outline color of the rectangle, in the Format Shape box, click Line Color in the left pane. Click the arrow next to Fill Color
 , and then click the color you want.
 -
To make the outline wider or narrower, dashed, or another style, in the Format Shape box, click Line Style in the left pane. To change the width of the line, next to Width, click the up or down arrows to change the point size of the line. To change the style of the line, click the arrow next to Compound type or Dash type to select the style you want.
-
Use clip art to create a more elaborate border
There are dozens of styles of clip art that you can use to create a border on a slide. Some border styles are in the shape of a hollow rectangle, and all you need to do is resize them to look like a border along the edge of your slide. Other clip art border styles are solid shapes, and you may need to copy and paste or rotate or flip the shape to make it repeat around the edge of your slide.
-
If you are using PowerPoint 2010, on the Insert tab, in the Images group, click Clip Art.
If you are using PowerPoint 2007, on the Insert tab, in the Illustrations group, click Clip Art.
-
In the Clip Art task pane, click in the Search for box, type borders, and then click Go.
-
In the results list, double-click the border that you want to use, and then resize, copy, paste, rotate, or flip the shape it to make it look the way you want.
See also
Create a simple border by using the outline of a shape
-
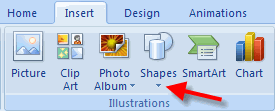
Select the slide you want and click Insert > Shapes > Rectangle.
Tip: To add a border to all your slides, edit the Slide Master.
-
Click and drag to draw the rectangle so it almost fills the slide.
-
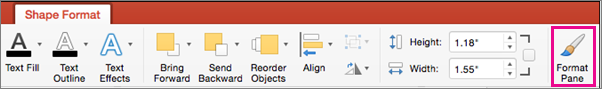
In the Shape Format tab, click Format Pane.
-
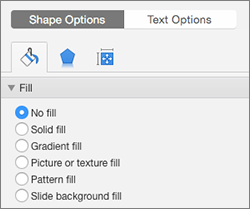
In the Shape Options pane at the right, under Fill, click No Fill.
-
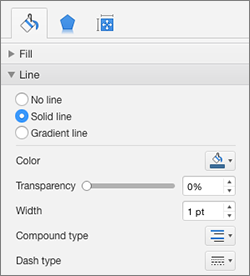
In the Format Shape pane, under Line, set the color and line style you want.
Use Bing Images to create a more elaborate border
-
Search for slide borders on Bing.
Important: Bing gives you access to thousands of Creative Commons licensed images on the Web . Remember, you're responsible for respecting the rights of others' property, including copyright.
-
Ctrl+click the image you want and click Save Image As to download it.
-
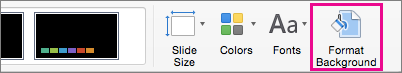
In PowerPoint, click Design > Format Background.
-
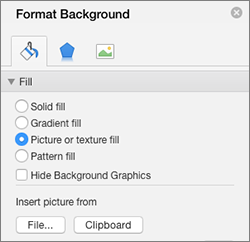
In the Format background pane at the right, click Fill > Picture or texture fill.
-
Under Insert picture from, click File, browse for the border you downloaded, and click Insert.
-
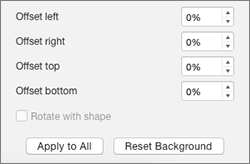
If the picture you loaded doesn't fit your slide, make sure all of the offset values in the Format background pane are set to zero percent (0%).
-
If you want to use this border for all your slides, click Apply to All.
See Also
Create a simple border by using the outline of a shape
-
Click Insert, and click the Shapes drop-down menu.
-
Select a shape from the Rectangles category.
-
A small default rectangle is drawn on the slide.
-
To eliminate the coloring inside the shape, select the Format tab, and select the Shape Fill drop-down menu. Click No Fill.
(The Format tab is available on the Ribbon after you select a shape by clicking it.)
-
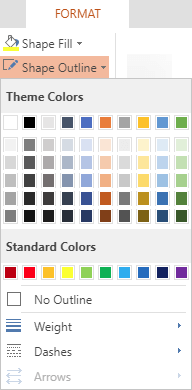
On the Format tab, select Shape Outline, and choose the color you want for the border.
-
Select Shape Outline again. Use the Weight and Dashes options near the bottom of the menu to select the line thickness and style you want for your border.
-
Drag the handles on the shape to size and position the border on the slide.
Use Bing Image Search to insert a border
You can also search for a new border to use in your presentation. PowerPoint uses a Bing Image Search to locate and download borders. You can search for new border images if you are connected to the Internet.
-
On the slide where you want to add a border, click Insert > Online Pictures.
-
Type a search phrase, like line borders or flower borders in the Bing Image Search box, and press Enter.
-
Select a border image, and click Insert to add it to your slide.
Note: The Bing Image Search results bring up images that are licensed under Creative Commons. For more information, see Add clip art to your file.
See also
The best way to learn about Word 2013 is to start using it. Create a blank document and learn the basics of adding and formatting text.
Want more?
When you first open Word 2013, this is what you see.
You can open an existing file here, or choose a template and create a new document.
Since we are just starting out, let's keep it simple and open the Blank document template.
Your new document opens here.
This area at the top is called the ribbon.
As you work on your document, you can use the tools in the ribbon to modify your text, or add pictures, or change the margins, things like that.
Word has a lot of useful tools and features, but you don't need to know all of this to create a document.
In fact, you can just start typing. Press Enter to start a new paragraph.
Otherwise, keep typing, and Word moves you to the next line automatically.
Press Backspace to remove characters to the left, press the arrow keys to move the cursor, and press Delete to remove characters to the right.
If you want to go faster, you can use the mouse to move the cursor.
As you get more comfortable with Word, you'll find yourself wanting to do more.
For example, you can take advantage of Word's spellchecker.
Word points out potential spelling errors by underlining the text in red.
You can retype the word, if you want, or better yet, right-click the word and get a list of suggested correct spellings.
Select one, or tell Word to Ignore the spelling.
Word also checks your grammar and word usage with a blue underline.
As your document grows and begins to take shape, there will be times when you'll want to move some things around.
You can do that by cutting, or copying and pasting.
Watch while I switch these two paragraphs around. First, I select the second paragraph, Cut it, click the beginning of the first paragraph, and click Paste.
Let's go back and take a closer look at that.
First, you select what you want to move.
Click and hold the left mouse button at the beginning and drag the mouse to the end. The area you select turns gray.
If you want to get rid of the selection, just click some place.
Now if you want to go faster, you can make a selection without dragging the mouse.
Just double-click to select a word. Click three times and you select the whole paragraph.
You'll see that there is always more than one way to do things in Word.
Next, we need to cut the text.
But you can't do that by pressing Delete, because that will permanently remove the text.
We need to use the Cut and Paste commands up here on the ribbon.
These words at the top are called Tabs.
When you click one, you display all the commands and options in the tab.
The Cut and Paste commands are on the HOME tab.
When you click Cut, Word removes the text and places it in the computer's memory in a location called the Clipboard.
Word also rearranges the document, so you don't see where the text was cut.
Word will do this anytime when something is added or removed.
Next, we select where we want to move the paragraph.
Then, come back to the ribbon and click Paste. And Word inserts the text from the clipboard.
Notice that you can click Copy instead of Cut, if you don't want to remove the original text.
So cutting and pasting is one way to move text.
But let's go back, and I'll show you even a faster way by using the mouse.
Instead of using the clipboard buttons, you can just click the selected text, and hold the left mouse button as you drag it to a new location.
So, now you have all the information you need to create a basic document or a rough draft. Up next, we'll save our document and move on.
Create a program structure diagram
Create a program structure diagram
You can use the Program Structure template to create structural diagrams of programs and memory objects.
-
On the File menu, point to New, point to Software and Database, and then click Program Structure.
-
From Language Level Shapes and Memory Objects, drag program structure shapes onto the drawing page.
-
Connect shapes as necessary.
-
Continue dragging shapes onto the drawing page and connecting them until you've completed your diagram.
Insert a page break
Insert a page break
-
On the form template, click where you want to start a new page.
-
On the Insert menu, click Page Break.
Note: In design mode, a page break appears as a dashed line in the form area. If you preview your form template, you won't see this dashed line or any other indication of the page break. To test how your changes will look on the printed form, click Print Preview
 on the Standard toolbar.
End of support for Office 2007
End of support for Office 2007
Support for Office 2007 ended on October 10, 2017. All of your Office 2007 apps will continue to function. However, you could expose yourself to serious and potentially harmful security risks. Upgrade to a newer version of Office so you can stay up to date with all the latest features, patches, and security updates.

Monday, July 30, 2018
Using hyperlinks in a workbook in the browser
Using hyperlinks in a workbook in the browser
A hyperlink is a link from one document to another that opens the second page or file when you click it. You can use a hyperlink in a workbook in the browser exactly as you can in other applications.
The following sections describe how to use a hyperlink to move to different kinds of target locations, and how create a hyperlink for use in a workbook in the browser.
What do you want to do?
Use a hyperlink in a workbook in the browser
After you add a hyperlink to the Excel workbook and save it to a site, you can use the hyperlink to browse to a different location and open the page that you specified. For example, you can
Open a document, file, or Web Page in a new window . When you link to a document or Web page outside the current workbook, the Web viewer opens a new window in the browser to display it.
Start an e-mail program and create a message. When you click a hyperlink to an e-mail address, your e-mail program automatically starts and creates an e-mail message that has the correct address in the To box.
Go to another location in the current workbook . If a hyperlink connects to another location in the current workbook, the active cell selection changes to the new location in workbook, but does not open a separate window.
Navigating to another location in the current workbook can be very useful, especially in a large workbook that contains many worksheets. For example, you might create a dedicated worksheet that behaves as a main menu, with links to each separate worksheet. Or, you might create links that connect cells in one worksheet to related information in a different worksheet.
Creating a hyperlink to use in a browser-based workbook
You cannot create a hyperlink directly in a workbook in Excel Services. Instead, you must create or edit a hyperlink in a workbook by using Excel, and then publish or upload the workbook to a document library. There are several ways to create a hyperlink. You can type a URL directly in a cell, use the Hyperlink button in the Links group in Excel, or use the Hyperlink function.
When you create a hyperlink in an Excel workbook, the hyperlink encodes the destination as a Uniform Resource Locator (URL). The URL can take different forms, depending on the destination location (on the Web, in the same document, etc.). The See Also section contains a link that provides detailed information about (and many examples of) different kinds of hyperlinks in an Excel workbook.
The following examples of hyperlink syntax contain detailed explanations of the elements of the hyperlink. You can use these examples to help you create hyperlinks.
-
Link to a Web page
This example shows a hyperlink that connects to a separate Web page that is located on the www.example.com Web server:
http://www.example.com/jan07/news.htm.
URL Component
Description
http://
The protocol designator that indicates the destination is a Web location.
www.example.com
The address of the Web server or network location
Jan07
The path or folder on the server
News.htm
The file name of the destination page
-
Get data from another Web page
You can create or run a Web query that retrieves data from a Web page. You can also create a Web query that retrieves data that is stored at a location on the Internet, or on a company intranet. A Web query sends the target location as a query string at the end of the base address of the target page. Web pages often contain information that is perfect for analysis in Excel. For example, you can use a Web query to retrieve data from another workbook on your company intranet.
For example, this hyperlink opens the Customer Order section of a corporate Web site. Then, it locates a workbook called PurchaseOrder23456, and finds the cell range F1 through F8 on the May worksheet:
http://MySharePointServer/MySite/_layouts/xlviewer.aspx?id=http://CorporateServer/CustomerOrderSite/Shared%20Documents/PurchaseOrder23456.xlsx&range=May!F2:F8
URL Component
Description
http://
The protocol (HTTP is required for Web locations)
MySharePointServer/MySite/_layouts
The intranet site
xlviewer.aspx
The Excel Web Access viewer
?id
The question mark character begins the URL query string
http://CorporateServer/CustomerOrderSite/Shared%20Documents/
The site address of the destination
PurchaseOrder23456.xlsx
The workbook name
&range=
The ampersand (&) character connects the workbook name to the range value of the destination cells
May
The worksheet name in the workbook
!
The exclamation point character connects the worksheet name to the range of cells that is the destination
F2:F8
The actual range of cells that is the target of the query
If you pass a workbook location as a query string parameter in a hyperlink, the viewer opens a new window (or a new tab in the browser. Then, the viewer focus moves to the specific workbook location. If it is a cell location, the viewer positions the cell in the center of the Web page. If it is a local or global named range, the viewer positions upper-left cell of the range in the center of the Web page. In either case, the viewer does not select the cell.
Differences between hyperlinks in a workbook in the browser and in Excel
In most ways, a hyperlink in a workbook in the browser behaves exactly like a hyperlink in an Excel workbook. However, there are some differences.
-
Workbooks in the browser only support absolute hyperlinks, or hyperlinks that contain a full address. This includes the protocol, the Web Server, the path, and the file name. They do not support relative hyperlinks, which contain only part of a full address. In contrast, Excel supports both absolute hyperlinks and relative hyperlinks.
-
Workbooks in the browser determine the color of a hyperlink from the default hyperlink color defined for the browser, unless you explicitly specify the default hyperlink color in the Excel workbook.
-
The Web-based viewer converts hyperlinks that reference a whole column or row in Excel to a reference to the first cell in that row or column.
-
The Web-based viewer does not support hyperlinks in charts, graphic hyperlinks, or hyperlinks to noncontiguous ranges. Instead, the viewer converts links such as these to text strings.
Web Part property settings that affect hyperlinks
The Excel Web Access Web Part offers custom properties that you can use to help control the behavior of hyperlinks. The following table describes the properties.
| If this property's check box: | Is selected: | Is cleared: |
| Allow Hyperlinks | All supported hyperlinks to files and documents outside the current workbook are active. This is the default behavior. | All supported hyperlinks to locations outside the workbook are converted to inactive text strings. |
| Allow Navigation | All supported hyperlinks to locations within the current workbook are active. This is the default behavior. | All supported hyperlinks to locations within the workbook are converted to inactive text strings. |
Ways to add values in a spreadsheet
Ways to add values in a spreadsheet
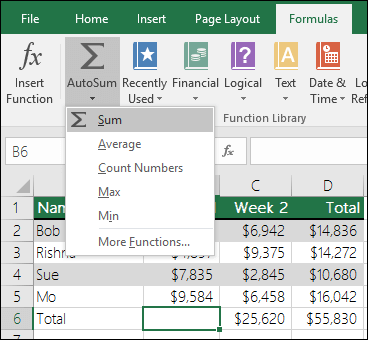
One quick and easy way to add values in Excel is to use AutoSum. Just select an empty cell directly below a column of data. Then on the Formula tab, click AutoSum > Sum. Excel will automatically sense the range to be summed. (AutoSum can also work horizontally if you select an empty cell to the right of the cells to be summed.)
AutoSum creates the formula for you, so that you don't have to do the typing. However, if you prefer typing the formula yourself, see the SUM function.
Add based on conditions
-
Use the SUMIF function when you want to sum values with one condition. For example, when you need to add up the total sales of a certain product.
-
Use the SUMIFS function when you want to sum values with more than one condition. For instance, you might want to add up the total sales of a certain product, within a certain sales region.
Add or subtract dates
For an overview of how to add or subtract dates, see Add or subtract dates. For more complex date calculations, see Date and time functions.
Add or subtract time
For an overview of how to add or subtract time, see Add or subtract time. For other time calculations, see Date and time functions.
Need more help?
You can always ask an expert in the Excel Tech Community, get support in the Answers community, or suggest a new feature or improvement on Excel User Voice.
Work with state shapes in UML statechart and activity diagrams
Work with state shapes in UML statechart and activity diagrams
Add an internal action or activity to a state in a statechart or activity diagram
-
In a statechart diagram or activity diagram, double-click the State shape you want to add the internal action or activity to.
-
In the UML State Properties dialog box, click Internal Transitions.
-
Type a name for the transition.
-
Click Properties. Choose the event you want. To create a new event, click Events, click New, choose the kind of event you want, and then click OK.
-
Type a name for the event and type or choose the other property values you want. Click a tab to add constraints, tagged values, or parameters, depending on the type of event you're creating. Click OK until you return to the Transition tab (UML Transition Properties dialog box).
-
Select Guard to add a guard condition, and then in the text box, type the guard condition you want.
-
Under Language, choose the language you want.
-
Click the Actions tab, and then click New to create an action expression. Choose the kind of action you want. Click OK, and then click Properties.
-
Type a name for the action and type or choose the other property values you want. Click a tab to add details, arguments, constraints, or tagged values. Click OK until you return to the Internal Transitions tab, and then click OK again.
By default, internal actions are hidden on a State shape. To show the internal actions, right-click the shape, and then click Shape Display Options. Under Suppress, clear the Transition check box.
Add entry and exit actions to a state in a statechart or activity diagram
-
On a statechart diagram or activity diagram, double-click the State shape you want to add an entry or exit action to.
-
In the UML State Properties dialog box, click Entry or Exit, and then click New.
-
Choose the action type you want, and then click OK. Type a name for the action.
-
Click Properties to add details, arguments, constraints or tagged values. Click OK until you close the UML State Properties dialog box.
By default, entry and exit actions are hidden on a State shape. To show the actions, right-click the shape, click Shape Display Options, and then clear Transition.
Defer events on an action state in an activity diagram
-
In the tree view or in an activity diagram, double-click the icon or shape representing an action state.
-
Click Deferred Events.
The events available in the package to which the action state belongs are listed. Select the events you want to be deferred by the state.
Apply a drop cap
Apply a drop cap
A drop cap is a large capital letter at the beginning of a text block that has the depth of two or more lines of regular text. The following illustration shows your options for positioning a drop cap.
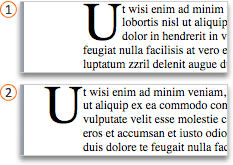
 Dropped
 In margin
Do any of the following:
Add or change a drop cap
-
On the View menu, click Print Layout.
-
Click the paragraph that you want to begin with a drop cap.
The paragraph must contain text, and cannot be inside a text container.
-
On the Format menu, click Drop Cap.
-
Click Dropped or In margin.
-
Select the options that you want.
Remove a drop cap
-
On the View menu, click Print Layout.
-
Click the paragraph that contains the drop cap that you want to remove.
-
On the Format menu, click Drop Cap.
-
Click None.
See also
PerformancePoint Dashboard Designer Help
PerformancePoint Dashboard Designer Help
We have detailed information available on TechNet about how to create, edit, and publish dashboards by using Dashboard Designer. Please see Create Dashboards by using PerformancePoint Services (SharePoint Server 2013) on TechNet.
Resolve app installation errors in Google Play Store
Resolve app installation errors in Google Play Store
You might receive an error that contains random numbers when you download Office apps from the Google Play store. The Google Play team is aware of this problem and is working to resolve the issues. In the meantime, please see below for more information and try the workarounds suggested.
What are Google Play Store errors?
Google Play Store Errors typically contain random numbers and are generated when you try to download apps from the Google Play Store. These errors might be due to Google Play Store updates, Google cache issues, Google Play Store stored data issues, or Google account issues.
The following are some of the most common Google Play Store errors:
-
Google Play Store error code 18
-
Google Play Store error code 20
-
Google Play Store error code 103
-
Google Play Store error code 194
-
Google Play Store error code 492
-
Google Play Store error code 495
-
Google Play Store error code 505
-
Google Play Store error code 506
-
Google Play Store error code 509
-
Google Play Store error code 905
Resolve Google Play Store Errors
Try the following workarounds to fix the Google Play Store errors.
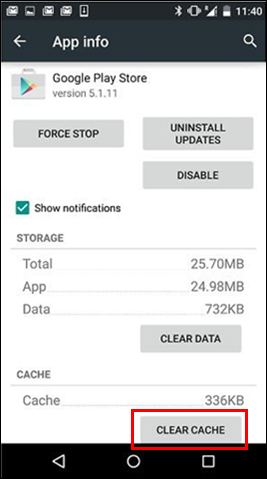
Clear the Google Play Store cache
-
Open the Settings menu on your device.
-
Go to Apps or Application Manager. (This option might differ depending on your device.)
-
Scroll to All apps and then scroll down to the Google Play Store app.
-
Open the app details and tap the Force stop button.
-
Tap the Clear cache button.
-
Repeat the steps above, but replace Google Play Store in step 3 with Google Play services.
-
Try to download the app again.

Clear the Google Play Store data
If cleaning the cache of the Google Play Store and Google Play Services doesn't resolve the issue, try clearing the Google Play Store data:
-
Open the Settings menu on your device.
-
Go to Apps or Application Manager. (This option might differ depending on your device.)
-
Scroll to All apps and then scroll down to the Google Play Store app.
-
Open the app details and tap the Force stop button.
-
Tap the Clear data button.

When the cache and data are cleared, the Google Play Store error should be resolved. If not, continue to the next step.
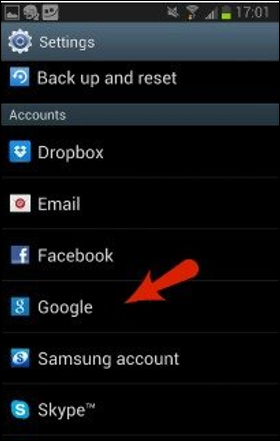
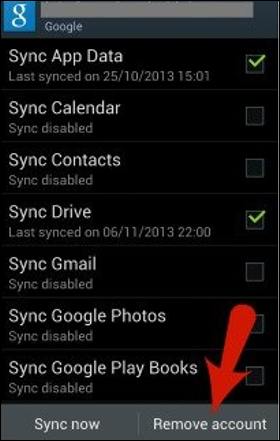
Remove your Google account and then add it again
If clearing the cache and data doesn't resolve the issue, remove your Google account, restart your device, and then add your Google account again.
-
Open the Settings menu on your device.
-
Under Accounts, tap the name of the account that you want to remove. If you're using a Google account, tap Google and then the account.
-
Tap the Menu icon on the top right corner of the screen.
-
Tap Remove account.
-
Restart your device and add your account again. Then try to download the app.
Additional help
If these steps don't resolve the error, refer to the following:
Create a Visio organization chart
Create a Visio organization chart
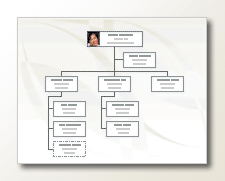
An organization chart (org chart) is a diagram of a reporting hierarchy that is commonly used to show relationships among employees, titles, and groups.
Org charts can range from simple diagrams, as in the following illustration, to large and complex diagrams that are based on information from an external data source. The shapes in your org chart can display basic information such as name and title, or details such as department and cost center. You can even add pictures to the org chart shapes.
Create a simple organization chart
When you want to create a small org chart with default information fields, follow these steps:
-
On the File tab, point to New, click Organization Chart, choose Metric Units or US Units and then click Create.
-
Click Cancel when you see the Organization Chart Wizard dialog box if you want to create only a simple org chart by yourself with default information fields.
-
The options on the Org Chart tab display various type of shapes, which you can use for members of your organization based on their positions.
Note: For information about how to add more data to the shapes, see Add data to shapes.
-
To automatically connect the shapes, drag the subordinate shapes onto superior shapes according to your organization hierarchy, or you can choose to manually connect using the connector shapes. Type a name and title for each one and also add a picture of members if you want.
-
You can arrange the Layout of org chart, space between shapes, the height and width of shapes, using the various commands and options on the Org Chart tab.
Automatically create an organization chart from a new data table
You can use this method if you want to change or add more information then default information fields, and you don't already have your data in a different program file.
-
On the File tab, point to New, click Organization Chart, choose Metric Units or US Units and then click Create.
-
On the first page of the Organization Chart Wizard, select Information that I enter using the wizard, and then click Next.
-
Select Excel or Delimited text, type a name for the new file, and then click Next.
Note: If you select Excel, a Microsoft Office Excel worksheet opens with sample text. If you select Delimited text, a Microsoft Notepad page opens with sample text.
-
When either Excel or Notepad opens, use the sample text as an example of what kind of information to include, and type your information over what is there.
Important: Do not delete Name and Reports_to columns, but you may change, delete, or add other columns you may need for your org chart.
-
Exit either Excel or Notepad file after adding your information, and then click Next to continue.
-
To include pictures on your org chart, select Don't include pictures in my organization chart, otherwise select Locate the folder that contains your organization pictures. Follow the remaining instructions on this page, and then click Next to continue.
-
On the last page of the wizard, you can specify how much of your organization to display on each page. You can choose I want to specify how much of my organization to display on each page, or you can let the wizard define each page automatically by selecting I want the wizard to automatically break my organization chart across the pages.
-
If you want to hyperlink and synchronize employee shape across the pages, select the options Hyperlink employee shape across the pages and Synchronize employee shape across the pages.
-
After you made all your selections, click Finish.
Note: Specific help is available for most wizard pages. To access Help, press F1 or click the Help button.
Automatically create an organization chart by using an existing data source
This method is best if the information that you want to include in your org chart is already in a document such as a Microsoft Office Excel worksheet, Microsoft Exchange Server directory, an ODBC-compliant data source, or an Org Plus text file.
-
Make sure your table or worksheet contains columns for employee names, unique IDs, and who reports to whom.
Note: You can name the columns whatever you want. When you run the Organization Chart Wizard, you can identify which columns (or field names) contain the name, ID, and report-to.
-
Employee name The way that employee names appear in this field is the way that they appear on the organization chart shapes.
-
Unique identifier If each name is not unique, include a column with a unique identifier, such as an employee ID number, for each employee.
-
Whom the employee reports to This field must contain each manager's unique identifier, whether that identifier is a name or an ID number. For the employee at the top of the organization chart, leave this field blank.
-
-
On the File tab, point to New, click Organization Chart, choose Metric Units or US Units and then click Create.
-
On the first page of the wizard, select Information that's already stored in a file or database and then click Next to continue.
-
Choose the file type where your organization information is stored in by clicking Browse, then browse to the location of this file. Select the language you want to use on the chart wizard and then click Next to continue.
-
On the next page of the wizard, select the column (fields) in your data file that contain the information that defines your organization such as Name, Reports To, and First Name. Click Next to continue.
-
On the next page of the wizard, you can define what specific fields you want displayed by using the Add and Remove buttons and the display order of the fields by using the Up and Down buttons. Click Next to continue.
-
On the next page of the wizard, you can choose the fields from your data file that you want to add to organization chart shapes as shape data fields. Click Next to continue.
-
To include pictures on your org chart, select Don't include pictures in my organization chart, otherwise select Locate the folder that contains your organization pictures. Follow the remaining instructions on this page, and then click Next to continue.
-
On the last page of the wizard, you can specify how much of your organization to display on each page. You can choose I want to specify how much of my organization to display on each page, or you can let the wizard define each page automatically by selecting I want the wizard to automatically break my organization chart across the pages.
-
If you want to hyperlink and synchronize employee shape across the pages, select the options Hyperlink employee shape across the pages and Synchronize employee shape across the pages.
-
After you made all your selections, click Finish.
Note: Specific help is available for most wizard pages. To access Help, press F1 or click the Help button.
Show teams by using the Team Frame or dotted lines
After you create an org chart, you can rearrange the information to reflect virtual team relationships. Move related shapes near each other, and then add dotted-line connectors to show secondary reporting structures, or use the Team Frame shape to highlight a virtual team. The dotted-line report behaves like an ordinary connector. The Team Frame is basically a modified rectangle shape that you can use to visually group and name teams.

Update generated organization charts
To reflect changes in the structure of an organization, you must update the org chart manually or generate a new chart. If you generate a new chart, no customizations that were made to the earlier chart are included in the new chart. If themes or photos were added to shapes, they must be added again to make the charts look similar.
If the shapes are linked to data, the data is updated normally when you run Refresh Data, but only inside existing shapes. Refreshing the data does not add or remove shapes.
Create a simple organization chart
This method is best for creating a small org chart with default information fields. The default fields are:
-
Department
-
Telephone
-
Name
-
Title
-
E-mail
-
On the File tab, point to New, point to Business, and then click Organization Chart.
-
From the Organization Chart Shapes stencil in the Shapes window, drag the top level shape for your organization, such as Executive, onto the page.
-
With the shape selected, type a name and title for the shape. For example, you might have an executive with the name Tosh Meston who holds the title of President.
Note: For information about how to add more data to the shapes, see Add data to shapes.
-
From the Organization Chart Shapes stencil in the Shapes window, drag a shape for the first subordinate person onto the superior shape. This automatically links the two in a hierarchy.
Tip: To generate the links, you need to drop the subordinate shape onto the center of the superior shape.
-
To complete your org chart, continue to drag subordinate shapes onto superior shapes, and type a name and title for each one.
Automatically create an organization chart from a new data table
This method is best if the default information fields don't fit what you need, and you don't already have your data in a different program.
-
On the File tab, point to New, point to Business, and then click Organization Chart Wizard.
-
On the first page of the wizard, select Information that I enter using the wizard, and then click Next.
-
Select Excel or Delimited text, type a name for the new file, and then click Next.
Note: If you select Excel, a Microsoft Office Excel worksheet opens with sample text. If you select Delimited text, a Microsoft Notepad page opens with sample text.
-
When either Excel or Notepad opens, use the sample text as an example of what kind of information to include, and type your information over what is there.
Important: You need to keep the Name and Reports to columns, but you can change, delete, or add others columns.
-
Exit either Excel or Notepad, and then complete the wizard.
Note: Specific help is available for most wizard pages. To access Help, press F1 or click the Help button.
Automatically create an organization chart by using an existing data source
This method is best if the information that you want to include in your org chart is already in a document such as a Microsoft Office Excel worksheet or a Microsoft Exchange Server directory.
-
Make sure your table or worksheet contains columns for employee names, unique IDs, and who reports to whom.
Note: You can name the columns whatever you want. When you run the Organization Chart Wizard, you can identify which columns (or field names) contain the name, ID, and report-to.
-
Employee name The way that employee names appear in this field is the way that they appear on the organization chart shapes.
-
Unique identifier If each name is not unique, include a column with a unique identifier, such as an employee ID number, for each employee.
-
Whom the employee reports to This field must contain each manager's unique identifier, whether that identifier is a name or an ID number. For the employee at the top of the organization chart, leave this field blank.
-
-
On the File tab, point to New, point to Business, and then click Organization Chart Wizard.
-
On the first page of the wizard, select Information that's already stored in a file or database.
-
Click Next, and follow the remaining steps of the wizard.
Note: Specific help is available for most wizard pages. To access Help, press F1 or click the Help button.
Show teams by using the Team Frame or dotted lines
After you create an org chart, you can rearrange the information to reflect virtual team relationships. Move related shapes near each other, and then add dotted-line connectors to show secondary reporting structures, or use the Team Frame shape to highlight a virtual team. The dotted-line report behaves like an ordinary connector. The Team Frame is basically a modified rectangle shape that you can use to visually group and name teams.
Update generated organization charts
To reflect changes in the structure of an organization, you must update the org chart manually or generate a new chart. If you generate a new chart, no customizations that were made to the earlier chart are included in the new chart. If themes or photos were added to shapes, they must be added again to make the charts look similar.
If the shapes are linked to data, the data is updated normally when you run Refresh Data, but only inside existing shapes. Refreshing the data does not add or remove shapes.
Create a simple organization chart
This method is best for creating a small org chart with default information fields. The default fields are:
-
Department
-
Telephone
-
Name
-
Title
-
E-mail
-
On the File menu, point to New, point to Business, and then click Organization Chart.
-
From the Organization Chart Shapes stencil in the Shapes window, drag the top level shape for your organization, such as Executive, onto the page.
-
With the shape selected, type a name and title for the shape. For example, you might have an executive with the name Tosh Meston who holds the title of President.
-
From the Organization Chart Shapes stencil in the Shapes window, drag a shape for the first subordinate person onto the superior shape. This automatically links the two in a hierarchy.
Tip: To generate the links, you need to drop the subordinate shape onto the center of the superior shape.
-
To complete your org chart, continue to drag subordinate shapes onto superior shapes, and type a name and title for each one.
Automatically create an organization chart from a new data table
This method is best if the default information fields don't fit what you need, and you don't already have your data in a different program.
-
On the File menu, point to New, point to Business, and then click Organization Chart Wizard.
-
On the first page of the wizard, select Information that I enter using the wizard, and then click Next.
-
Select Excel or Delimited text, type a name for the new file, and then click Next.
Note: If you select Excel, a Microsoft Office Excel worksheet opens with sample text. If you select Delimited text, a Microsoft Notepad page opens with sample text.
-
When either Excel or Notepad opens, use the sample text as an example of what kind of information to include, and type your information over what is there.
Important: You need to keep the Name and Reports to columns, but you can change, delete, or add others columns.
-
Exit either Excel or Notepad, and then complete the wizard.
Note: Specific help is available for most wizard pages. To access Help, press F1 or click the Help button.
Automatically create an organization chart by using an existing data source
This method is best if the information that you want to include in your org chart is already in a document such as a Microsoft Office Excel worksheet or a Microsoft Exchange Server directory.
-
Make sure your table or worksheet contains columns for employee names, unique IDs, and who reports to whom.
Note: You can name the columns whatever you want. When you run the Organization Chart Wizard, you can identify which columns (or field names) contain the name, ID, and report-to.
-
Employee name The way that employee names appear in this field is the way that they appear on the organization chart shapes.
-
Unique identifier If each name is not unique, include a column with a unique identifier, such as an employee ID number, for each employee.
-
Whom the employee reports to This field must contain each manager's unique identifier, whether that identifier is a name or an ID number. For the employee at the top of the organization chart, leave this field blank.
-
-
On the File menu, point to New, point to Business, and then click Organization Chart Wizard.
-
On the first page of the wizard, select Information that's already stored in a file or database.
-
Click Next, and follow the remaining steps of the wizard.
Note: Specific help is available for most wizard pages. To access Help, press F1 or click the Help button.
Show teams by using the Team Frame or dotted lines
After you create an org chart, you can rearrange the information to reflect virtual team relationships. Move related shapes near each other, and then add dotted-line connectors to show secondary reporting structures, or use the Team Frame shape to highlight a virtual team. The dotted-line report behaves like an ordinary connector. The Team Frame is basically a modified rectangle shape that you can use to visually group and name teams.
Update generated organization charts
To reflect changes in the structure of an organization, you must update the org chart manually or generate a new chart. If you generate a new chart, no customizations that were made to the earlier chart are included in the new chart. If themes or photos were added to shapes, they must be added again to make the charts look similar.
If the shapes are linked to data, the data is updated normally when you run Refresh Data, but only inside existing shapes. Refreshing the data does not add or remove shapes.