When you add a modern page to a site, you add and customize web parts, which are the building blocks of your page. This article describes the Quick chart web part.
Note: Some functionality is introduced gradually to organizations that have opted in to the Targeted Release program. This means that you may not yet see this feature or it may look different than what is described in the help articles.

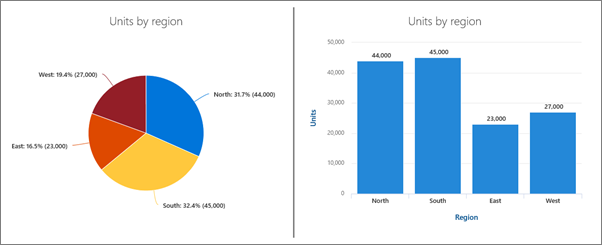
Use the Quick chart web part to add simple, basic charts to your page. Enter your data points or get data from a list or library, add labels, pick your chart type (column or pie), and publish.
Add the Quick chart web part
-
If you're not in edit mode already, click Edit at the top right of the page.
-
Hover your mouse above or below an existing web part or under the title region, click
 , and then select the Quick chart web part.
 -
To add a title, click on the chart. You'll see an option to name your chart.
-
Click Edit web part
 to configure the settings for your Quick chart.
 -
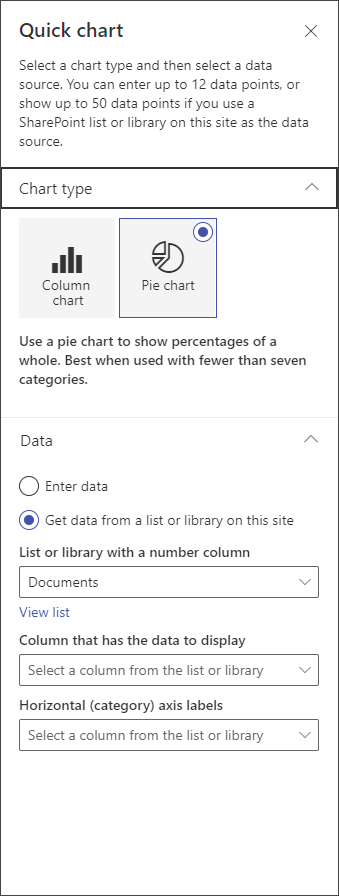
In the toolbox on the right, choose a chart type.
-
In the Data section, choose to enter data manually or get data from an existing SharePoint list or library.
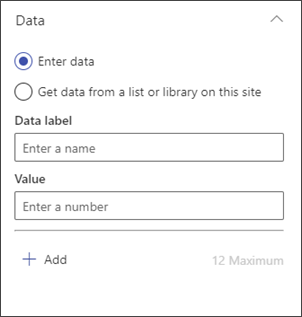
Enter data manually: Select the Enter data option, and then add a label and a numeric value for each data point. Click + Add to create additional data points up to a maximum of 12 data points.
Get data from a SharePoint list or library: Select the option to Get data from a SharePoint list or library on this site, and then select the list or library.
-
Format your chart by assigning data sources from your list or library. In the Column that has data to display section, the information in this section has to be a numerical value in order for the Quick chart to function properly.


Note: The option to Get data from a SharePoint list or library on this site is not available in SharePoint Server 2019.
-
If you are creating a column chart, under Layout, you can optionally add labels for the horizontal (x) axis and the vertical (y) axis for column charts.

HAVE YOU BEEN SCAMMED OF YOUR COINS AND WANTS TO GET IT RECOVERED BACK???
ReplyDeleteI invested a total of$95,000.00USD worth of Bitcoin with an online company who does trading and was guaranteed a payout of 25% a week. They ended up shutting down their company website but their website was still running. So I could still see my dashboard at that time and instead of paying weekly they ended up compounding my money. It ended up compounding to$179, 000USD so I requested for a withdrawal which was declined before they shutdown their website, I complained to my colleague at work who directed me about this recovery expert, Mr. Morris Ray, that helped him, I contacted him immediately, what surprised me most, was that I recovered my money that same week. You can contact him on his email at MorrisGray830 @ Gmail . com and on WhatsApp: + 1 (607) 698-0239 and he will assist you on the steps to recover your invested funds.
Just trying to help those who where scammed just the way I was too.