Tuesday, October 31, 2017

Copy and paste a slide

Copy and paste a slide

Copying and pasting in PowerPoint Online differs from copying and pasting in the PowerPoint desktop application because of web browser technology limitations. If you are using the Firefox browser to access the PowerPoint Online, see Copy and paste slides using Firefox.

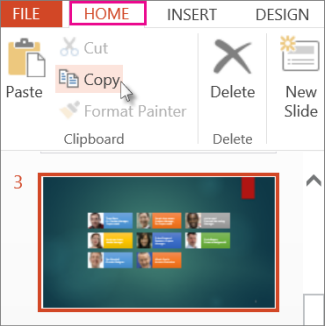
  1. Select the slide you want to copy, and then on the Home tab, click Copy.

Copy a slide

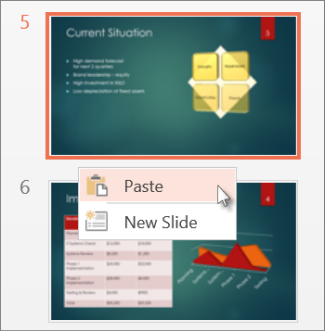
  1. Still in the thumbnail pane, right-click where you want the copied slide to be pasted, and then click Paste.

Click Paste

Note:  If you are prompted for access to the Clipboard, click Allow Access.

Copy and paste slides using Firefox

You'll need to use keyboard shortcuts to copy and paste slides using the Firefox browser.

  1. In the thumbnail pane, select the slide you want to copy, and on the keyboard, press Ctrl+C.

  2. Still in the thumbnail pane, go to where you want to paste the slide, and on the keyboard, press Ctrl+P.

Apply or remove strikethrough text formatting

Apply or remove strikethrough text formatting

You can use this procedure to apply strikethrough formatting to text in a document. You can follow the same steps to remove strikethrough formatting.

Note: If you're looking for information about using tracked changes and comments, see Track changes in Word.

Apply or remove single-line strikethrough formatting

  1. Select the text that you want to format.

  2. On the Home tab, in the Font group, click Strikethrough.

    Strikethrough on the Home tab

Apply or remove double-line strikethrough formatting

  1. Select the text that you want to format.

  2. On the Home tab, click the Font Dialog Box Launcher, and then click the Font tab.

    font dialog box launcher

  3. Select the Double strikethrough check box.

    To remove double-like strikethrough formatting, select the text, and then click Strikethrough twice in the Font group on the Home tab.

    Strikethrough on the Home tab

Resolve the 0xE0190193 (403: Forbidden) error in OneNote

Resolve the 0xE0190193 (403: Forbidden) error in OneNote

If you're seeing the 0xE0190193 error code, you're trying to access a shared notebook or section that is no longer available to you. This can happen when the owner of the notebook (or the server administrator) intentionally or accidentally changes your permissions.

To resolve this issue, contact the owner of the shared notebook you're trying to use and ask them to check your permissions to view and edit the notebook.

Top of Page

UML Action State Properties dialog box (Action State category)

UML Action State Properties dialog box (Action State category)

Name

Type the name of the action state.

Stereotype

Choose the stereotype you want from the drop-down list. If a stereotype you want to use isn't listed, you can add a new stereotype or edit an existing one by clicking Stereotypes on the UML menu.

Partition

Choose the partition you want. You define partitions by dragging Swimlane shapes onto the drawing page, and naming the partition each swimlane represents.

Documentation

Type any documentation you want to add to the element as a tagged value. When you select the shape or icon representing the element, the documentation you type here also appears in the Documentation window.

Align objects in Office for Mac

Align objects in Office for Mac

In Word, PowerPoint, and Excel for Mac, you can easily align objects—such as pictures, shapes, SmartArt, and charts—in relation to other objects, the edges of the page, or the margins.

Word

  1. Hold down Shift , click the objects that you want to align, and then click the Shape Format tab.

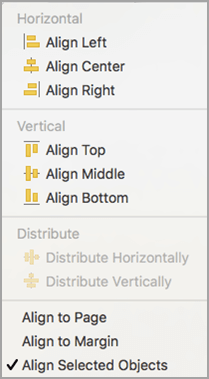
  2. Click Arrange > Align > Align Selected Objects.

    Align Selected Objects

    This is selected by default.

    If Align Selected Objects is not available

    In the document, select at least two objects. The Align Selected Objects option becomes enabled.

  3. Click Arrange > Align, and then click the alignment that you want.

  1. Hold down Shift , click the objects that you want to align, and then click the Shape Format tab.

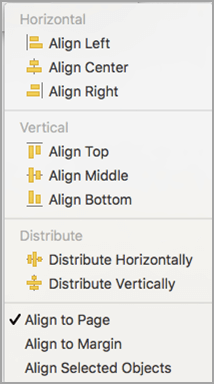
  2. Click Arrange > Align > Align to Page.

    Align to Page

  3. Click Arrange > Align, and then click the alignment that you want.

To more easily align objects, you can use a grid. Or, you can snap your objects to a grid line that runs through the vertical edges, horizontal edges, and center of other objects. The line becomes visible only when you drag an object near another object.

To use a grid, you have to first turn on the grid option.

  1. On the Word menu, click Preferences.

  2. In the Word Preferences box, under Authoring and Proofing Tools, click Edit.

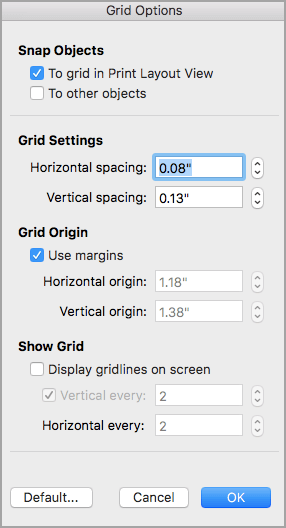
  3. In the Edit box, click Grid Options.

  4. In the Grid Options box, select the type of snap-to behavior that you want:

    • To snap objects to a grid, under Snap Objects, select To grid in Print Layout View.

    • To snap objects to other objects, under Snap Objects, select To other objects.

    Grid Options

  5. (Optional) You can set other grid settings such as spacing.

  6. To show the gridlines, under Show Grid, select Display gridlines on screen.

    Note: You can also toggle the gridlines on and off by selecting or clearing the Gridlines check box on the View tab or View menu.

  7. Click OK.

After you choose a grid option, align your objects as follows.

  1. Hold down Shift , click the objects that you want to align, and then click the Shape Format tab.

  2. Click Arrange > Align, and select an alignment option. If you displayed the gridlines, you will see that the objects are aligned on the grid.

    Tip: If you set the preference to align to grid but want to suspend this setting while you move an object, hold down COMMAND as you drag the object.

PowerPoint

  1. Hold down Shift , click the objects that you want to align, and then click the Shape Format tab.

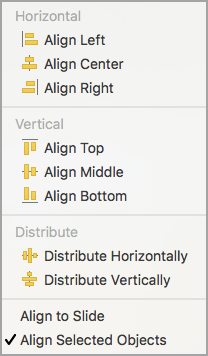
  2. Click Align > Align Selected Objects.

    Align Selected Objects

    This is selected by default.

    If Align Selected Objects is not available

    In the document, select at least two objects. The Align Selected Objects option becomes enabled.

  3. Click Align, and then click the alignment that you want.

  1. Hold down Shift , click the objects that you want to align, and then click the Shape Format tab.

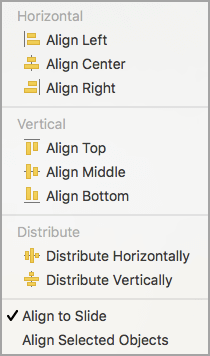
  2. Click Align > Align to Slide.

    Align to Slide

  3. Click Align, and then click the alignment that you want.

To more easily align objects, you can snap your objects to a grid line that runs through the vertical edges, horizontal edges, and centers of other objects. The line becomes visible only when you drag an object near another object.

  • Click View > Guides >Snap to Grid.

Dynamic Guides — lines that run through the center of other objects and the center of the slide  — appear when you drag an object. You can use dynamic guides to align an object relative to another object. Or, you can align an object relative to the center of a slide.

  1. Click View > Guides > Dynamic Guides.

  2. Click the object that you want to align.

    Tip: To select multiple objects, hold down Shift , and then click the objects that you want.

  3. Drag the object near another object that you want to align it with, or drag the object near the center of the page.

    Note: To temporarily hide Dynamic Guides, hold down Command while you drag the object.

  4. Use the grid lines that appear to obtain the alignment that you want.

Excel

  1. Hold down Shift , click the objects that you want to align, and then click the Shape Format tab.

  2. Click Align, and then click the alignment that you want.

See also

Move, rotate, or group a picture, text box, or other object

Resize an object

Word

  1. Hold down Shift, click the objects that you want to align, and then click the Format tab.

  2. Click Arrange > Align > Align Selected Objects.

    Word Arrange group

    This is selected by default.

    If Align Selected Objects is not available

    In the document, select at least two objects. The Align Selected Objects option becomes enabled.

  3. Click Arrange > Align, and then click the alignment that you want.

  1. Hold down Shift, click the objects that you want to align, and then click the Format tab.

  2. Click Arrange > Align > Align to Page.

    Word Arrange group

  3. Click Arrange > Align, and then click the alignment that you want.

To more easily align objects, you can use a grid. Or, you can snap your objects to a grid line that runs through the vertical edges, horizontal edges, and center of other objects. The line becomes visible only when you drag an object near another object.

  1. Hold down Shift, click the objects that you want to align, and then click the Format tab.

  2. Click Arrange > Align > Grid Options.

    Word Arrange group

  3. Do one of the following:

    To automatically align objects

    Do this

    On a grid in Publishing Layout view

    Under Snap objects, select the To grid in Publishing Layout View check box.

    On a grid in Print Layout view

    Under Snap objects, select the To grid in Print Layout View check box.

    With grid lines that go through other shapes

    Under Snap objects, select the To other objects check box.

    Tip: If you set the preference to align to grid but want to suspend this setting while you move an object, hold down COMMAND as you drag the object.

Static Guides make it easy to manually align text boxes, graphics, and other objects precisely to a specified area of a document.

  1. On the View menu, click Publishing Layout.

  2. On the View menu, make sure that Ruler has a check mark next to it.

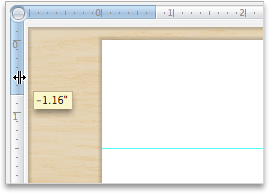
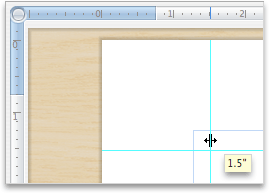
  3. Rest the pointer over a blue portion of the horizontal or vertical ruler until the pointer turns into a double-headed arrow.

    Rest pointer over ruler

  4. Drag a guide onto the page and position it anywhere you want.

    Drag guide onto page

PowerPoint

  1. Hold down Shift , click the objects that you want to align, and then click the Format tab.

  2. Click Arrange > Align > Align Selected Objects.

    Word Arrange group

    This is selected by default.

    If Align Selected Objects is not available

    In the document, select at least two objects. The Align Selected Objects option becomes enabled.

  3. Click Arrange > Align, and then click the alignment that you want.

  1. Hold down Shift , click the objects that you want to align, and then click the Format tab.

  2. Click Arrange > Align > Align to Slide.

    Word Arrange group

  3. Click Arrange > Align, and then click the alignment that you want.

To more easily align objects, you can snap your objects to a grid line that runs through the vertical edges, horizontal edges, and centers of other objects. The line becomes visible only when you drag an object near another object.

  • On the View menu, point to Guides, and then select Snap to Grid.

To more easily align objects, you can snap your objects to other objects on the slide. The line becomes visible only when you drag an object near another object.

  • On the View menu, point to Guides and then select Snap to Shape.

Static Guides make it easy to manually align text boxes, graphics, and other objects precisely to a specified area of a document.

  1. On the View menu, point to Guides, and then click Static Guides.

  2. To add additional guides, hold down Option and drag a guide anywhere you want.

Dynamic Guides — lines that run through the center of other objects and the center of the slide — appear when you drag an object. You can use Dynamic Guides to align an object relative to another object. Or, you can align an object relative to the center of a slide.

  1. On the View menu, point to Guides, and then click Dynamic Guides.

  2. Click the object that you want to align.

    Tip: To select multiple objects, hold down Shift, and then click the objects that you want.

  3. Drag the object near another object that you want to align it with, or drag the object near the center of the page.

    Note: To temporarily hide Dynamic Guides, hold down Command while you drag the object.

  4. Use the grid lines that appear to obtain the alignment that you want.

Excel

  1. Hold down Shift , click the objects that you want to align, and then click the Format tab.

  2. Click Arrange > Align, and then click the alignment that you want.

    Word Arrange group

See also

Move, rotate, or group a picture, text box, or other object

Resize an object

Enter or change a task duration

Enter or change a task duration

When you initially create a new task, Project 2007 gives the task an estimated duration of one day. You can modify the estimated task duration to reflect the actual amount of time that the task requires. You can modify your estimate at a later time; however, it is best practice to hone your estimation skills so that your initial project plans are realistic for your organization.

Tip: Changing the task duration is one method that you can use to help meet your finish date, resolve any resource overallocations, cut costs, increase the scope, or increase the quality.

Increase the accuracy of your estimates

To increase the accuracy of your estimates for task duration, use your own past experience and the past experiences of others who have done something similar in previous projects. Ask questions such as:

  • How long did the task take?

  • What were some of the challenges you encountered?

  • What would you do differently if you had to do it over again?

Note any differences between the new task and similar tasks done in the past, and take into account those differences when you estimate a task's duration.

Include the following considerations as you estimate task durations:

  • Durations can depend on the experience of the resource who performs the task. A highly experienced resource can sometimes complete certain tasks more quickly than a less experienced resource.

  • Estimates should be revisited when the work starts. You will know more about the tasks at that point.

You can also derive your estimates by comparing optimistic, pessimistic, and expected durations. This is sometimes called a PERT analysis.

Enter or change task duration

  1. If the task you are entering the duration for is not currently listed in the project plan, add the task to your task list. If you are entering or changing the duration for an existing task, skip this step.

    How do I add a new task?

    1. On the View menu, click Gantt Chart.

    2. In the Task Name field, type a task name at the end of the task list.

      You can insert a task between existing tasks by selecting the row below where you want a new task to appear. On the Insert menu, click New Task and then type the task name in the inserted row. The task IDs are automatically renumbered after you insert a task.

  2. In the Duration column for the task, type the duration that you want.

    You can enter durations in minutes (m), hours (h), days (d), weeks (w), or months (mo).

  3. If the new duration is an estimate, type a question mark after it.

  4. Press ENTER.

Tip: To change the one-day default value, on the Tools menu, click Options and then click the Schedule tab. Clear the New tasks have estimated durations check box.

Tip: To express the durations of new tasks in units other than days, on the Tools menu, click Options and then click the Schedule tab. In the Duration is entered in box, select a duration unit.

Notes: 

  • When you change a task's duration to meet a specific target, be sure that the change still reflects realistic time requirements for the task. Be sure to also check and adjust the corresponding amount of work that is assigned, as necessary.

  • Some projects may not use estimated durations. If your project does not use estimated durations and you type a question mark in the Duration column for a task, the value is not considered an estimation. To allow estimations in your project, on the Tools menu, click Options, and then click the Schedule tab. Select the Show that tasks have estimated durations check box.

  • If you are changing a duration and the new duration uses a different unit from the existing duration, you must first do the calculation separately and then enter the new value. There is no automatic conversion. For example, if the current duration for a task is 1 day, and you want to change the duration to reflect hours instead of days, you must first calculate the number of working hours in a day on your own and then enter the new value in hours.

  • Summary tasks (sometimes called "hammock tasks") cannot be edited directly. To change a summary task, change the subtasks that make up the summary task.

Top of Page

Create a UML deployment diagram

Create a UML deployment diagram

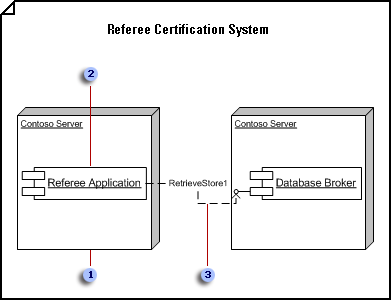
Deployment diagram showing the structure a run-time system

Callout 1 In a deployment diagram, a node can represent a generic type or a specific instance.

Callout 2 Place components and object instances within a node instance to indicate that the components and objects reside on the node.

Callout 3 Dependencies connect components, sometimes through interfaces. You can use a stereotype to indicate the precise dependency.

  1. On the File menu, point to New, point to Software, and then click UML Model Diagram.

  2. In the tree view, right-click a package or subsystem in which you want to include the deployment diagram, point to New, and then click Deployment Diagram.

    A blank page appears, and the UML Deployment stencil becomes the top-most stencil. The workspace displays 'Deployment' as a watermark. An icon representing the diagram is added to the tree view.

    Note: If the tree view isn't visible, point to View on the UML menu, and then click Model Explorer.

  3. Drag a Node shape onto the drawing page. Drag Component and Object shapes into the node. Drag a selection handle on the node to resize it.

    Contain elements within a node in a deployment diagram

    1. In a deployment diagram, drag a Node or Node Instance shape from the UML Deployment stencil onto the drawing page.

    2. Double-click the node to add a name, attributes, operations and other property values.

    3. Drag a corner selection handle to resize the node so it can accommodate the elements you want it to contain.

    4. Drag Component, Component Instance, and Object shapes on top of the Node shape, and then connect the shapes with dependency relationships where appropriate.

    5. Do one of the following:

      • Double-click each node. In the UML Node Properties dialog box, click Components. Under Choose the components which are deployed by this node, select the appropriate components, and then click OK.

      • Double-click each component. In the UML Component Properties dialog box, click Nodes. Under Choose the nodes which deploy this component, select the appropriate nodes, and then click OK.

        Note: Do not group a node and the shapes it contains. If you need to move a node and the elements within it, drag a selection rectangle around the node to select all the shapes, and then drag them to the position you want.

  4. Repeat step 3 until you have all the nodes you need.

  5. Where appropriate, drag an Interface shape onto the drawing page and glue the endpoint without the circle to a component shape.

    Add an interface to a class, component, or other element

    1. In a static structurecomponent, or deployment diagram, drag the lollipop Interface shape onto the drawing page.

    2. Glue the endpoint without the circle to a connection point Connection point image - blue X on the class component, or other element.

    3. Double-click the Interface shape to add a name, operations, and other property values.

      tiplist

      You can also represent an interface with a rectangular Interface shape that resembles a class. Use this shape when you want to display a list of the interface operations.

      To change the type of shape that displays for an interface, right-click the Interface shape and click Show as Class-like Interface or Show as Lollipop Interface.

  6. Use Communicates shapes to indicate the relationships between nodes.

    Indicate a communication association between nodes in a deployment diagram

    1. In a deployment diagram, drag a Communicates shape from the UML Deployment stencil onto the drawing page.

    2. Glue one endpoint of the Communicates shape to a connection point Connection point image - blue X on the first node.

    3. Glue the other endpoint of the Communicates shape to a connection point on the second node.

    4. Double-click the Communicates shape to add a name and other property values to the element and to its ends.

  7. Use Dependency shapes to indicate the relationships between components and objects, and between components and other components' interfaces.

    Indicate a dependency relationship between UML elements

    1. Drag a Dependency shape from the UML Static Structure, UML Deployment, or UML Component stencil onto the drawing page and place it near the elements you want to relate.

    2. Glue the endpoint with an arrowhead to a connection point Connection point image - blue X on the element the other element depends on. Glue the endpoint without an arrowhead to a connection point on the element that depends on the other element.

    3. Double-click the dependency to add a name, stereotype, and other properties.

      Tip: If you want to indicate a trace, refinement, usage, or binding dependency, you can use the Trace, Refinement, Usage, or Binding shapes from the UML Static Structure stencil.

  8. Double-click any shape to open its UML Properties dialog box where you can add a name, attributes, operations, and other properties.

  9. Save the diagram.

VARPA function

VARPA function

Calculates variance based on the entire population. In addition to numbers, text and logical values such as TRUE and FALSE are included in the calculation.

Syntax

VARPA(value1,value2,...)

Value1,value2,...     are 1 to 30 value arguments corresponding to a population.

Remarks

  • VARPA assumes that its arguments are the entire population. If your data represents a sample of the population, you must compute the variance using VARA.

  • Arguments that contain TRUE evaluate as 1; arguments that contain text or FALSE evaluate as 0 (zero). If the calculation must not include text or logical values, use VARP instead.

  • The equation for VARPA is :

    Equation

Example

Suppose all 10 tools stamped from the same machine during a production run are collected and measured for breaking strength.

St1

St2

St3

St4

St5

St6

St7

St8

St9

St10

Formula

Description (Result)

1345

1301

1368

1322

1310

1370

1318

1350

1303

1299

=VARPA([St1], [St2], [St3], [St4], [St5], [St6], [St7], [St8], [St9], [St10])

Variance of breaking strengths for all the tools, assuming that only 10 tools are produced (678.84)

Add or edit a SmartArt graphic in Office for Mac

Add or edit a SmartArt graphic in Office for Mac

A SmartArt graphic is a visual representation of your information and ideas. You can create SmartArt graphics by choosing from among many layouts to quickly, easily, and effectively communicate your message. SmartArt graphics, especially combined with other features such as themes, help you create designer-quality illustrations with only a few clicks of your mouse. You can create a SmartArt graphic in Excel for Mac, PowerPoint for Mac, and Word for Mac.

You can change the look of your SmartArt graphic by changing the fill of its shape or text; by adding effects, such as shadows, reflections, glows, or soft edges; or by adding three-dimensional (3-D) effects, such as bevels or rotations.

Which Office program are you using?

Word

PowerPoint

Excel

Word

A SmartArt graphic provides a visual representation of information so that you can more effectively communicate your message. Each graphic represents a different concept or idea, such as a process flow, an organization hierarchy, a relationship, and so on.

Insert a SmartArt graphic and add text

  1. On the Insert tab, click SmartArt, click a SmartArt graphic type (such as Relationship), and then click the one that you want to add.

  2. In the SmartArt Text pane, type the text that you want to include in your SmartArt graphic.

    When you are finished, close the SmartArt Text pane.

    Tip: You can add text directly in a SmartArt graphic shape by clicking [TEXT] in the shape, and then typing the text that you want.

    If you can't see the text pane

    Click the SmartArt graphic.

    On the left side of the SmartArt graphic, click the arrow.

Add, delete, or move shapes

  1. Click the whole SmartArt graphic or individual shape that you want to change.

  2. Do any of the following:

To

Do this

Add a shape

On the SmartArt Design tab, click Add Shape.

Delete a shape

In the Text Pane, click Text Pane Remove button .

Move a shape up

On the SmartArt Design tab, click Move Up.

Move a shape down

On the SmartArt Design tab, click Move Down.

Lower the level of a shape

On the SmartArt Design tab, click Demote.

Raise the level of a shape

On the SmartArt Design tab, click Promote.

If you can't see the text pane

  1. Click the SmartArt graphic.

  2. On the left side of the SmartArt graphic, click the arrow.

Change the style of the SmartArt graphic

If you applied a theme to your presentation, the SmartArt graphic styles available for you to choose from coordinate with the theme and theme colors.

  1. In the document, click the SmartArt graphic that you want to change.

  2. On the SmartArt Design tab, click the style you want.

    SmartArt tab, SmartArt Graphic Styles group

    To see more styles, point to a style, and then click More Down Arrow .

Change the color of a SmartArt graphic

If you applied a theme to your presentation, the SmartArt graphic colors available for you to choose from coordinate with the theme colors.

  1. In the document, click the SmartArt graphic that you want to change.

  2. On the SmartArt Design tab, click Change Colors, and then click the color theme that you want.

    SmartArt tab, SmartArt Graphic Styles group

Change the orientation of a SmartArt graphic

You can change the orientation of certain SmartArt graphic types from left to right or right to left.

  1. In the document, click the SmartArt graphic that you want to change.

  2. On the SmartArt Design tab, click Right to Left.

    SmartArt tab, Edit SmartArt group

    Note: You cannot change the orientation of some SmartArt graphics.

Reset the SmartArt graphic to remove formatting

You can reset the SmartArt graphic to the default appearance. This removes changes that you have made to the color, style, shape, and text style of a SmartArt graphic.

  1. In the document, click the SmartArt graphic that you want to change.

  2. On the SmartArt Design tab, click Reset Graphic.

    Word SmartArt tab, Reset group

See also

Format a SmartArt graphic

Create an organization chart

PowerPoint

A SmartArt graphic provides a visual representation of information so that you can more effectively communicate your message. Each graphic represents a different concept or idea, such as a process flow, an organization hierarchy, a relationship, and so on.

Insert a SmartArt graphic and add text

  1. On the Insert tab, click SmartArt, click a SmartArt graphic type (such as Relationship), and then click the one that you want to add.

  2. In the SmartArt Text pane, type the text that you want to include in your SmartArt graphic.

    When you are finished, close the SmartArt Text pane.

    Tip: You can add text directly in a SmartArt graphic shape by clicking [TEXT] in the shape, and then typing the text that you want.

    If you can't see the text pane

    Click the SmartArt graphic.

    On the left side of the SmartArt graphic, click the arrow.

Add, delete, or move shapes

  1. Click the whole SmartArt graphic or individual shape that you want to change.

  2. Do any of the following:

To

Do this

Add a shape

On the SmartArt Design tab, click Add Shape.

Delete a shape

In the Text Pane, click Text Pane Remove button .

Move a shape up

On the SmartArt Design tab, click Move Up.

Move a shape down

On the SmartArt Design tab, click Move Down.

Lower the level of a shape

On the SmartArt Design tab, click Demote.

Raise the level of a shape

On the SmartArt Design tab, click Promote.

If you can't see the text pane

  1. Click the SmartArt graphic.

  2. On the left side of the SmartArt graphic, click the arrow.

Change the style of the SmartArt graphic

If you applied a theme to your presentation, the SmartArt graphic styles available for you to choose from coordinate with the theme and theme colors.

  1. In the document, click the SmartArt graphic that you want to change.

  2. On the SmartArt Design tab, click the style you want.

    SmartArt tab, SmartArt Graphic Styles group

    To see more styles, point to a style, and then click More Down Arrow .

Change the color of a SmartArt graphic

If you applied a theme to your presentation, the SmartArt graphic colors available for you to choose from coordinate with the theme colors.

  1. In the document, click the SmartArt graphic that you want to change.

  2. On the SmartArt Design tab, click Change Colors, and then click the color theme that you want.

    SmartArt tab, SmartArt Graphic Styles group

Change the orientation of a SmartArt graphic

You can change the orientation of certain SmartArt graphic types from left to right or right to left.

  1. In the document, click the SmartArt graphic that you want to change.

  2. On the SmartArt Design tab, click Right to Left.

    SmartArt tab, Edit SmartArt group

    Note: You cannot change the orientation of some SmartArt graphics.

Reset the SmartArt graphic to remove formatting

You can reset the SmartArt graphic to the default appearance. This removes changes that you have made to the color, style, shape, and text style of a SmartArt graphic.

  1. In the document, click the SmartArt graphic that you want to change.

  2. On the SmartArt Design tab, click Reset Graphic.

    Word SmartArt tab, Reset group

See also

Format a SmartArt graphic

Create an organization chart

Convert a SmartArt graphic to shapes

Convert text to a SmartArt graphic and vice versa

Excel

A SmartArt graphic provides a visual representation of information so that you can more effectively communicate your message. Each graphic represents a different concept or idea, such as a process flow, an organization hierarchy, a relationship, and so on.

Insert a SmartArt graphic and add text

  1. On the Insert tab, click SmartArt, click a SmartArt graphic type (such as Relationship), and then click the one that you want to add.

  2. In the SmartArt Text pane, type the text that you want to include in your SmartArt graphic.

    When you are finished, close the SmartArt Text pane.

    Tip: You can add text directly in a SmartArt graphic shape by clicking [TEXT] in the shape, and then typing the text that you want.

    If you can't see the text pane

    Click the SmartArt graphic.

    On the left side of the SmartArt graphic, click the arrow.

Add, delete, or move shapes

  1. Click the whole SmartArt graphic or individual shape that you want to change.

  2. Do any of the following:

To

Do this

Add a shape

On the SmartArt Design tab, click Add Shape.

Delete a shape

In the Text Pane, click Text Pane Remove button .

Move a shape up

On the SmartArt Design tab, click Move Up.

Move a shape down

On the SmartArt Design tab, click Move Down.

Lower the level of a shape

On the SmartArt Design tab, click Demote.

Raise the level of a shape

On the SmartArt Design tab, click Promote.

If you can't see the text pane

  1. Click the SmartArt graphic.

  2. On the left side of the SmartArt graphic, click the arrow.

Change the style of the SmartArt graphic

If you applied a theme to your presentation, the SmartArt graphic styles available for you to choose from coordinate with the theme and theme colors.

  1. In the document, click the SmartArt graphic that you want to change.

  2. On the SmartArt Design tab, click the style you want.

    SmartArt tab, SmartArt Graphic Styles group

    To see more styles, point to a style, and then click More Down Arrow .

Change the color of a SmartArt graphic

If you applied a theme to your presentation, the SmartArt graphic colors available for you to choose from coordinate with the theme colors.

  1. In the document, click the SmartArt graphic that you want to change.

  2. On the SmartArt Design tab, click Change Colors, and then click the color theme that you want.

    SmartArt tab, SmartArt Graphic Styles group

Change the orientation of a SmartArt graphic

You can change the orientation of certain SmartArt graphic types from left to right or right to left.

  1. In the document, click the SmartArt graphic that you want to change.

  2. On the SmartArt Design tab, click Right to Left.

    SmartArt tab, Edit SmartArt group

    Note: You cannot change the orientation of some SmartArt graphics.

Reset the SmartArt graphic to remove formatting

You can reset the SmartArt graphic to the default appearance. This removes changes that you have made to the color, style, shape, and text style of a SmartArt graphic.

  1. In the document, click the SmartArt graphic that you want to change.

  2. On the SmartArt Design tab, click Reset Graphic.

    Word SmartArt tab, Reset group

See also

Format a SmartArt graphic

Create an organization chart

Convert a SmartArt graphic to shapes

Which Office program are you using?

Word

PowerPoint

Excel

Word

A SmartArt graphic provides a visual representation of information so that you can more effectively communicate your message. Each graphic represents a different concept or idea, such as a process flow, an organization hierarchy, a relationship, and so on.

Do any of the following:

Insert a SmartArt graphic and add text

  1. On the SmartArt tab, under Insert SmartArt Graphic, click a SmartArt graphic type, and then click the one that you want to add.

    SmartArt tab, Insert SmartArt Graphic group

  2. In the Text Pane, type the text that you want to include in your SmartArt graphic.

    When you are finished, click the X to close the Text Pane.

    Tip: You can add text directly in a SmartArt graphic shape by clicking [TEXT] in the shape, and then typing the text that you want.

    If you can't see the text pane

    1. Click the SmartArt graphic.

    2. On the left side of the SmartArt graphic, click Text Pane .

Add, delete, or move shapes

  1. Click the whole SmartArt graphic or individual shape that you want to change.

  2. Do any of the following:

To

Do this

Add a shape

In the Text Pane, click Add SmartArt Shape button .

Delete a shape

In the Text Pane, click Text Pane Remove button .

Move a shape up

In the Text Pane, click Move Up .

Move a shape down

In the Text Pane, click Move down .

Lower the level of a shape

In the Text Pane, click Demote button .

Raise the level of a shape

In the Text Pane, click Promote button .

If you can't see the text pane

  1. Click the SmartArt graphic.

  2. On the left side of the SmartArt graphic, click Text Pane .

Change the style of the SmartArt graphic

If you applied a theme to your presentation, the SmartArt graphic styles available for you to choose from coordinate with the theme and theme colors.

  1. In the document, click the SmartArt graphic that you want to change.

  2. On the SmartArt tab, under SmartArt Graphic Styles, click the style that you want.

    SmartArt tab, SmartArt Graphic Styles group

    To see more styles, point to a style, and then click More Down Arrow .

Change the color of a SmartArt graphic

If you applied a theme to your presentation, the SmartArt graphic colors available for you to choose from coordinate with the theme colors.

  1. In the document, click the SmartArt graphic that you want to change.

  2. On the SmartArt tab, under SmartArt Graphic Styles, click Colors, and then click the color theme that you want.

    SmartArt tab, SmartArt Graphic Styles group

Change the orientation of a SmartArt graphic

You can change the orientation of a SmartArt graphic from left to right or right to left.

  1. In the document, click the SmartArt graphic that you want to change.

  2. On the SmartArt tab, under Edit SmartArt, click Right to Left.

    SmartArt tab, Edit SmartArt group

    Note: You cannot change the orientation of some SmartArt graphics.

Reset the SmartArt graphic to remove formatting

You can reset the SmartArt graphic to the default appearance. This removes changes that you have made to the color, style, shape, and text style of a SmartArt graphic.

  1. In the document, click the SmartArt graphic that you want to change.

  2. On the SmartArt tab, under Reset, click Reset Graphic.

    Word SmartArt tab, Reset group

See also

Format a SmartArt graphic

Create an organization chart

PowerPoint

A SmartArt graphic provides a visual representation of information so that you can more effectively communicate your message. Each graphic represents a different concept or idea, such as a process flow, an organization hierarchy, a relationship, and so on.

Do any of the following:

Insert a SmartArt graphic and add text

  1. On the SmartArt tab, under Insert SmartArt Graphic, click a SmartArt graphic type, and then click the one that you want to add.

    SmartArt tab, Insert SmartArt Graphic group

  2. In the Text Pane, type the text that you want to include in your SmartArt graphic.

    When you are finished, click the X to close the Text Pane.

    Tip: You can add text directly in a SmartArt graphic shape by clicking [TEXT] in the shape, and then typing the text that you want.

    If you can't see the text pane

    1. Click the SmartArt graphic.

    2. On the left side of the SmartArt graphic, click Text Pane .

Add, delete, or move shapes

  1. Click the whole SmartArt graphic or individual shape that you want to change.

  2. Do any of the following:

To

Do this

Add a shape

In the Text Pane, click Add SmartArt Shape button .

Delete a shape

In the Text Pane, click Text Pane Remove button .

Move a shape up

In the Text Pane, click Move Up .

Move a shape down

In the Text Pane, click Move down .

Lower the level of a shape

In the Text Pane, click Demote button .

Raise the level of a shape

In the Text Pane, click Promote button .

If you can't see the text pane

  1. Click the SmartArt graphic.

  2. On the left side of the SmartArt graphic, click Text Pane .

Change the style of the SmartArt graphic

If you applied a theme to your presentation, the SmartArt graphic styles available for you to choose from coordinate with the theme and theme colors.

  1. In the document, click the SmartArt graphic that you want to change.

  2. On the SmartArt tab, under SmartArt Graphic Styles, click the style that you want.

    SmartArt tab, SmartArt Graphic Styles group

    To see more styles, point to a style, and then click More Down Arrow .

Change the color of a SmartArt graphic

If you applied a theme to your presentation, the SmartArt graphic colors available for you to choose from coordinate with the theme colors.

  1. In the document, click the SmartArt graphic that you want to change.

  2. On the SmartArt tab, under SmartArt Graphic Styles, click Colors, and then click the color theme that you want.

    SmartArt tab, SmartArt Graphic Styles group

Change the orientation of a SmartArt graphic

You can change the orientation of a SmartArt graphic from left to right or right to left.

  1. In the document, click the SmartArt graphic that you want to change.

  2. On the SmartArt tab, under Edit SmartArt, click Right to Left.

    SmartArt tab, Edit SmartArt group

    Note: You cannot change the orientation of some SmartArt graphics.

Reset the SmartArt graphic to remove formatting

You can reset the SmartArt graphic to the default appearance. This removes changes that you have made to the color, style, shape, and text style of a SmartArt graphic.

  1. In the document, click the SmartArt graphic that you want to change.

  2. On the SmartArt tab, under Reset, click Reset Graphic.

    PowerPoint SmartArt tab, Reset group

See also

Format a SmartArt graphic

Create an organization chart

Convert a SmartArt graphic to shapes

Convert text to a SmartArt graphic and vice versa

Excel

A SmartArt graphic provides a visual representation of information so that you can more effectively communicate your message. Each graphic represents a different concept or idea, such as a process flow, an organization hierarchy, a relationship, and so on.

Do any of the following:

Insert a SmartArt graphic and add text

  1. On the SmartArt tab, under Insert SmartArt Graphic, click a SmartArt graphic type, and then click the one that you want to add.

    SmartArt tab, Insert SmartArt Graphic group

  2. In the Text Pane, type the text that you want to include in your SmartArt graphic.

    When you are finished, click the X to close the Text Pane.

    Tip: You can add text directly in a SmartArt graphic shape by clicking [TEXT] in the shape, and then typing the text that you want.

    If you can't see the text pane

    1. Click the SmartArt graphic.

    2. On the left side of the SmartArt graphic, click Text Pane .

Add, delete, or move shapes

  1. Click the whole SmartArt graphic or individual shape that you want to change.

  2. Do any of the following:

To

Do this

Add a shape

In the Text Pane, click Add SmartArt Shape button .

Delete a shape

In the Text Pane, click Text Pane Remove button .

Move a shape up

In the Text Pane, click Move Up .

Move a shape down

In the Text Pane, click Move down .

Lower the level of a shape

In the Text Pane, click Demote button .

Raise the level of a shape

In the Text Pane, click Promote button .

If you can't see the text pane

  1. Click the SmartArt graphic.

  2. On the left side of the SmartArt graphic, click Text Pane .

Change the style of the SmartArt graphic

If you applied a theme to your presentation, the SmartArt graphic styles available for you to choose from coordinate with the theme and theme colors.

  1. In the document, click the SmartArt graphic that you want to change.

  2. On the SmartArt tab, under SmartArt Graphic Styles, click the style that you want.

    SmartArt tab, SmartArt Graphic Styles group

    To see more styles, point to a style, and then click More Down Arrow .

Change the color of a SmartArt graphic

If you applied a theme to your presentation, the SmartArt graphic colors available for you to choose from coordinate with the theme colors.

  1. In the document, click the SmartArt graphic that you want to change.

  2. On the SmartArt tab, under SmartArt Graphic Styles, click Colors, and then click the color theme that you want.

    SmartArt tab, SmartArt Graphic Styles group

Change the orientation of a SmartArt graphic

You can change the orientation of a SmartArt graphic from left to right or right to left.

  1. In the document, click the SmartArt graphic that you want to change.

  2. On the SmartArt tab, under Edit SmartArt, click Right to Left.

    SmartArt tab, Edit SmartArt group

    Note: You cannot change the orientation of some SmartArt graphics.

Reset the SmartArt graphic to remove formatting

You can reset the SmartArt graphic to the default appearance. This removes changes that you have made to the color, style, shape, and text style of a SmartArt graphic.

  1. In the document, click the SmartArt graphic that you want to change.

  2. On the SmartArt tab, under Reset, click Reset Graphic.

    Excel SmartArt tab, Reset group

See also

Format a SmartArt graphic

Create an organization chart

Convert a SmartArt graphic to shapes