Important: In Excel for Microsoft 365 and Excel 2021, Power View is removed on October 12, 2021. As an alternative, you can use the interactive visual experience provided by Power BI Desktop, which you can download for free. You can also easily Import Excel workbooks into Power BI Desktop.
Scatter and bubble charts are a great way to display a lot of related data in one chart. In scatter charts, the x-axis displays one numeric field and the y-axis displays another, making it easy to see the relationship between the two values for all the items in the chart.
In a bubble chart, a third numeric field controls the size of the data points.

Create a bubble chart
-
Create a table with one category value.
Tip: Pick a category that doesn't have too many values. If the category has more than 2,000 values, you see a note that the chart is "showing representative sample" rather than all the categories. Really, it's hard to see individual bubbles if you have a lot of them.
-
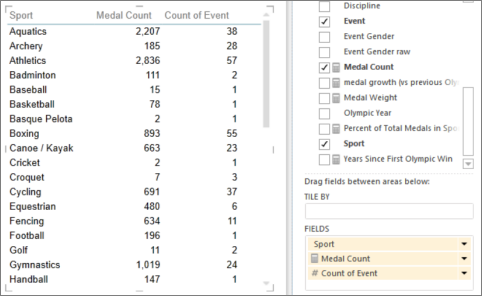
Add two or three numeric values to the table.
-
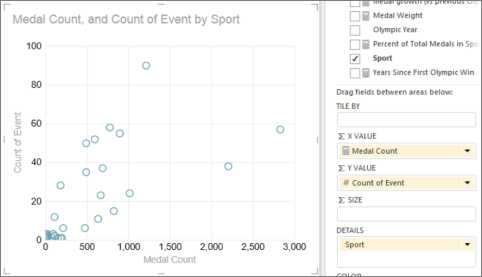
With two values, you get a scatter chart of little circles, all the same size.
-
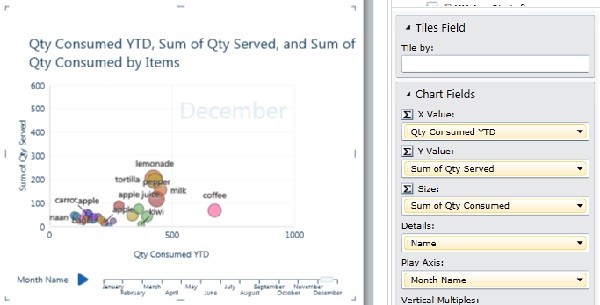
With three values, you get bubble chart. Each bubble is a different color and the size of the bubble illustrates the third value.
-
-
To convert the table to a chart, on the Design tab:
-
In Power View in Excel, click the arrow under Other Chart and click Scatter.
-
In Power View in SharePoint, click Scatter.
Power View automatically puts the category in the Details box, and the two numeric values in the X Value and Y Value boxes.
-
Follow data over time
To view changes in data over time, you can add a time dimension to scatter and bubble charts, with a 'play' axis.
-
Select the bubble or scatter chart and drag a field with time values to the Play Axis box.
This adds a 'play' button and time line to the bottom of the chart.
When you click the play button, the bubbles travel, grow, and shrink to show how the values change based on the play axis. You can pause at any point to study the data in more detail. When you can click a bubble on the chart, you can see its history in the trail the bubble has followed over time.
Color-based categories for scatter and bubble charts
You can add a field to the Color box for a scatter or bubble chart, and it colors the bubbles or scatter points differently, according to the different values in that field, overriding the bubble colors. For example, adding the Category field to a bubble chart of foods assigns different colors to the bubbles depending on if they are fruits, vegetables, breads, or beverages.

The field can't be a calculated field, and can have no more than twenty instances.
Note: You can click a color in the legend to highlight all the bubbles for that color, but that doesn't show traces for all the bubbles in that color. You have to click each bubble individually to show its trace. You can select more than one bubble at a time by pressing Ctrl + Click.
Notes: Video copyrights:
-
Olympics Dataset © Guardian News & Media Ltd.
-
Flag images courtesy of CIA Factbook (cia.gov)
-
Population data courtesy of UNData (data.un.org ) on Microsoft Azure Marketplace.
-
Olympic Sport Pictograms by Thadius856 and Parutakupiu, distributed according to the license on Wikimedia Commons (creativecommons.org/licenses/by-sa/3.0/)
See Also
Charts and other visualizations in Power View
Power View: Explore, visualize, and present your data
Power View and Power Pivot videos
Tutorial: PivotTable data analysis using a Data Model in Excel 2013
HAVE YOU BEEN SCAMMED OF YOUR COINS AND WANTS TO GET IT RECOVERED BACK???
ReplyDeleteI invested a total of$95,000.00USD worth of Bitcoin with an online company who does trading and was guaranteed a payout of 25% a week. They ended up shutting down their company website but their website was still running. So I could still see my dashboard at that time and instead of paying weekly they ended up compounding my money. It ended up compounding to$179, 000USD so I requested for a withdrawal which was declined before they shutdown their website, I complained to my colleague at work who directed me about this recovery expert, Mr. Morris Ray, that helped him, I contacted him immediately, what surprised me most, was that I recovered my money that same week. You can contact him on his email at MorrisGray830 @ Gmail . com and on WhatsApp: + 1 (607) 698-0239 and he will assist you on the steps to recover your invested funds.
Just trying to help those who where scammed just the way I was too.
Microsoft Office Tutorials: Bubble And Scatter Charts In Power View >>>>> Download Now
ReplyDelete>>>>> Download Full
Microsoft Office Tutorials: Bubble And Scatter Charts In Power View >>>>> Download LINK
>>>>> Download Now
Microsoft Office Tutorials: Bubble And Scatter Charts In Power View >>>>> Download Full
>>>>> Download LINK ef
Had a credit union mistakenly apply my payment 2 days later than I should have missing my statement and date. They said they fixed the mistake and I will see this correction on my next statement but the issue is it was reported to the bureaus with wrong amount prior to them correcting this. The amount is over $16k so this is making a huge impact on my credit score/utilization/total balances and ability to get approved for new credit. Well, I fixed my credit and got rid off my debts with the help of PINNACLE CREDIT SPECIALIST whom a trusted friend recommended and he did a perfect job increasing my credit score to (801 TransUnion, 805 Experian, 807 Equifax) all credit card debts are marked as paid, public record, bankruptcy and hard inquiries are all gone. I’m so happy. I refer this great hacker to those who have a fixed date to fix their credit profile. Text PINNACLE ON +1 (585) 466 4373. Tell them Tricia Walton Referred you. You can also reach them on PINNACLECREDITSPECIALIST@GMAIL.COM
ReplyDelete