Create a basic flowchart
Flowcharts are diagrams that show the steps in a process. Basic flowcharts are easy to create and, because the shapes are simple and visual, they are easy to understand.
Note You can also automatically create a basic flow chart from data by using a Data Visualizer diagram in Visio Online Plan 2. For more information, see Create a Data Visualizer diagram.
The Basic Flowchart template in Visio comes with shapes that you can use to show many kinds of processes, and it is especially useful for showing basic business processes like the proposal development process shown in the following figure.
In addition to the Basic Flowchart template, Visio provides a variety of templates for more specific kinds of diagrams, such as data flow diagrams, timelines, and software modeling.
Create a flowchart
-
Start Visio.
-
Click the Flowchart category.
-
Double-click Basic Flowchart.
-
For each step in the process that you are documenting, drag a flowchart shape onto your drawing.
-
Connect the flowchart shapes by holding the mouse pointer over the first shape, and then clicking the small arrow that appears that points to the shape you want to connect to. If the second shape is not directly across from the first shape, click and hold the small arrow, drag it to the second shape, and drop the connector in the middle of the second shape.
-
To add text to a shape or connector, select it, and then type. When you are finished typing, click on a blank area of the page.
-
To change the direction of a connector's arrow, select the connector, and then, on the Shape tab, in the Shape Styles group, click Line, point to Arrows, and select the arrow direction and style that you want.
Fix alignment and spacing
-
Press CTRL+A to select everything on the drawing page.
-
On the Home tab, in the Arrange group, click Position, and then click Auto Align & Space.
If that doesn't do what you want, press Ctrl+Z to undo it, and then try some of the other options under the Align and Position buttons.
What the flowchart shapes represent
When you open the Basic Flowchart template, the Basic Flowchart Shapes stencil opens too. Each shape on the stencil represents a different kind of step in a process. However, there is no standard, universal meaning for the shapes – any shape can carry whatever meaning is agreed on by the people who will create and read the flowcharts. Most flowcharts tend to use only three or four of the shapes, unless there is a clear business reason to use more.
That said, Visio shapes have names that suggest their most common uses. Here are some of the most common shapes:
-
Start/End Use this shape for the first and last step of your process.

-
Process This shape represents a typical step in your process. This is the most frequently used shape in almost every process.

-
Decision This shape indicates a point where the outcome of a decision dictates the next step. There can be multiple outcomes, but often there are just two — yes and no.

-
Subprocess Use this shape for a set of steps that combine to create a sub-process that is defined elsewhere, often on another page of the same document. This is useful if the diagram is very long and complex.

-
Document This shape represents a step that results in a document.

-
Data This shape indicates that information is coming into the process from outside, or leaving the process. This shape can also be used to represent materials and is sometimes called an Input/Output shape.

-
On-page reference This small circle indicates that the next (or previous) step is somewhere else on the drawing. This is particularly useful for large flowcharts where you would otherwise have to use a long connector, which can be hard to follow.

-
Off-page reference When you drop this shape onto your drawing page, a dialog box opens where you can create a set of hyperlinks between two pages of a flowchart or between a sub-process shape and a separate flowchart page that shows the steps in that sub-process.

What the flowchart shapes represent
When you open the Basic Flowchart template, the Basic Flowchart Shapes stencil opens too. Each shape on the stencil represents a different step in a process.
Visio 2010 includes many other, specialized stencils and shapes that you can use in your flowchart diagram. For more information about how to find more shapes, see Use the Shapes window to organize and find shapes.
-
Start/End Use this shape for the first and last step of your process.
-
Process This shape represents a step in your process.
-
Subprocess Use this shape for a set of steps that combine to create a sub-process that is defined elsewhere, often on another page of the same drawing.
-
Document This shape represents a step that results in a document.
-
Data This shape indicates that information is coming into the process from outside, or leaving the process. This shape can also be used to represent materials and is sometimes called an Input/Output shape.
-
On-page reference This small circle indicates that the next (or previous) step is somewhere else on the drawing. This is particularly useful for large flowcharts where you would otherwise have to use a long connector, which can be hard to follow.
-
Off-page reference When you drop this shape onto your drawing page, a dialog box opens where you can create a set of hyperlinks between two pages of a flowchart or between a sub-process shape and a separate flowchart page that shows the steps in that sub-process.
Note: Can't find the shape you need? To learn about how to find other shapes, see Use the Shapes window to organize and find shapes
Create a flowchart
-
Click the File tab.
Don't see the File tab?
If you do not see the File tab, proceed to the next step in the procedure.
-
Click New, click Flowchart, and then under Available Templates, click Basic Flowchart.
-
Click Create .
-
For each step in the process that you are documenting, drag a flowchart shape onto your drawing.
Note: See the section What the flowchart shapes represent for information on which shapes to use for each step.
-
Connect the flowchart shapes in either of the following ways.
Connect two shapes together.
-
On the Home tab, in the Tools group, click Connector.
-
Drag from a connection point
 on the first shape to a connection point on the second shape. The connector endpoints turn red when the shapes are connected.
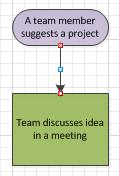
Connect one shape to many from a single connection point.
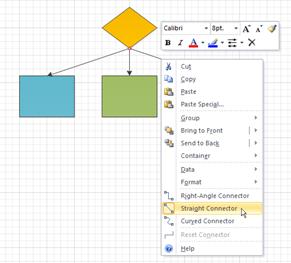
By default, connectors are set to Right-Angle so that if you connect a single point on one shape to three other shapes it will look like the figure below.
To have each connector radiate straight from the central point on the first shape to points on each of the other shapes you need to set the connectors to Straight Connector as shown in the following figure.
-
On the Home tab, in the Tools group, click Connector.
-
For each shape you want to connect to, drag from the same connection point
on the first shape to a connection point on each of the other shapes. -
Right-click each connector and click Straight Connector.
-
-
To return to normal editing, on the Home tab, in the Tool group, click Pointer Tool.
-
To add text to a shape or connector, select it, and then type. When you are finished typing, click on a blank area of the page.
-
To change the direction of a connector's arrow, select the connection, and then in the Shape group, click the arrow to the right of Line, point to Arrows, and select the arrow direction that you want.
Print a large flowchart
The easiest way to print a flowchart that is larger than your printer paper is to print it onto multiple pieces of paper and then tape the pieces together.
Before you start to print, it's important to make sure that the drawing page, as it appears in Visio, contains the whole flowchart. Any shapes that hang off the edge of the Visio drawing page will not print.
To print a large flowchart, do the following:
-
With your flowchart open, on the Design tab, in the Page Setup group, click Size, and select Fit to Drawing.
-
Click the File tab.
Don't see the File tab?
If you do not see the File tab, proceed to the next step in the procedure.
-
Click Print, and then click Print Preview.
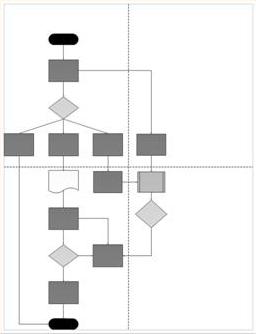 Dotted lines show how the drawing prints onto separate sheets.
 -
To print your flowchart onto multiple pieces of paper, do the following:
-
In Print Preview, in the Print group, click Page Setup.
-
On the Print Setup tab, in the Printer paper box, select the paper size you want if it isn't already selected.
-
Click OK.
-
In the Preview group, click Single Tile to see how your drawing will print on each sheet. (You can switch between pages by clicking Next Tile or Previous Tile.)
-
When you are satisfied with how your drawing looks, in the Print group, click Print.
-
After the drawing is printed, you can trim the margins, overlap the pages, and tape them together.
-
-
To print your flowchart onto a single piece of paper, do the following:
-
In Print Preview, in the Print group, click Page Setup.
-
On the Print Setup tab, in the Printer paper box, select the paper size you want if it isn't already selected.
-
Under Print zoom, select Fit to.
-
To the right of Fit to, type 1 in the box next to sheet(s) across , and type 1 in the box next to sheet(s) down .
-
Click OK.
-
In the Print group, click Print.
-
What the flowchart shapes represent
When you open the Basic Flowchart template, the Basic Flowchart Shapes stencil opens too. Each shape on the stencil represents a different step in a process.
Of all of the shapes on the Basic Flowchart Shapes stencil, only a few are commonly used. Those commonly used shapes are described here. For more information about the less commonly used shapes open the expandable link (Less frequently used flowchart shapes) at the end of this section.
-
Terminator Use this shape for the first and last step of your process.
-
Process This shape represents a step in your process.
-
Predefined process Use this shape for a set of steps that combine to create a sub-process that is defined elsewhere, often on another page of the same drawing.
-
Decision This shape indicates a point where the outcome of a decision dictates the next step. There can be multiple outcomes, but often there are just two —yes and no.
-
Document This shape represents a step that results in a document.
-
Data This shape indicates that information is coming into the process from outside, or leaving the process. This shape can also be used to represent materials and is sometimes called an Input/Output shape.
-
Flowchart shapes You can right-click this multi-shape to set to any of the following shapes: Process, Decision, Document, or Data. Any text you type onto the shape, or information you add to its Shape Data, remains with the shape.
This is what the shape looks like on the stencil:

This is what you see when you drag the shape onto the drawing page and right-click it:
-
Stored data Use this shape for a step that results in information being stored.

-
On-page reference This small circle indicates that the next (or previous) step is somewhere else on the drawing. This is particularly useful for large flowcharts where you would otherwise have to use a long connector, which can be hard to follow.
-
Off-page reference When you drop this shape onto your drawing page, a dialog box opens where you can create a set of hyperlinks between two pages of a flowchart or between a sub-process shape and a separate flowchart page that shows the steps in that sub-process.
Less frequently used flowchart shapes
-
Dynamic connector This connector draws a path around shapes it encounters.

-
Line-curve connector This connector has adjustable curvature.

-
Auto-height box This is a bordered text box that adjusts to accommodate the amount of text you type. You can set the width by dragging the sides of the shape. Although this shape doesn't represent a step in a process, it is a handy way to add a text box to your flowchart.

-
Annotation This bracketed text box adjusts to accommodate the amount of text you type. You can set the width by dragging the sides of the shape. Like the Auto-height box shape, this shape doesn't represent a step in a process. Use this to add comments about your flowchart shapes.
-
Manual input This is a step where a person provides information to the process.

-
Manual operation This is a step that must be performed by a person.

-
Internal storage This shape represents information stored on a computer.

-
Direct data This shape represents information stored so that any single record can be accessed directly. This represents how a computer hard-drive stores data.
-
Sequential data This shape represents information stored in sequence, such ad data on a magnetic tape. When data is stored in sequence, it must be retrieved in sequence. For example, in order to access record 7 you would have to first go through records 1 through 6.

-
Card and Paper tape This shape represents a physical card or paper tape. Early computer systems used a system of punch cards and paper tape to store and retrieve data and to store and run programs.

-
Display This shape represents information that is displayed to a person, usually on a computer screen.

-
Preparation This shape indicates where variables are initialized in preparation for a procedure.

-
Parallel mode This shape shows where two different processes can operate simultaneously.

-
Loop limit This shape marks the maximum number of times a loop can run before it must go on to the next step.

-
Control transfer This shape indicates a step that goes to a step other than the typical next step when certain conditions are met.

Create a flowchart
-
On the File menu, point to New, point to Flowchart, and then click Basic Flowchart.
-
For each step in the process that you are documenting, drag a flowchart shape onto your drawing.
-
Connect the flowchart shapes in either of the following ways.
Note: For information on other ways to connect shapes, see Add connectors between shapes in Visio.
Connect two shapes together.
-
Click the Connector tool
 on the Standard toolbar.
 -
Drag from a connection point
on the first shape to a connection point on the second shape. The connector endpoints turn red when the shapes are connected.
Connect one shape to many from a single connection point.
By default, connectors are set to Right-Angle so that if you connect a single point on one shape to three other shapes it will look like the figure below.
To have each connector radiate straight from the central point on the first shape to points on each of the other shapes you need to set the connectors to Straight Connector as shown in the following figure.
-
Click the Connector tool
on the Standard toolbar. -
For each shape you want to connect to, drag from the same connection point
on the first shape to a connection point on each of the other shapes. -
Right-click each connector and click Straight Connector.
-
-
Click the Pointer tool
 on the Standard toolbar to return to normal editing.
 -
To add text to a shape or connector, select it, and then type. When you are finished typing, click on a blank area of the page.
-
To change the direction of a connector's arrow, select the connection, and then on the Shape menu, point to Operations, and click Reverse Ends.
Printing large flowcharts
The easiest way to print out a flowchart that is larger than your printer paper is to print it onto multiple pieces of paper and then tape the pieces together.
Before you start printing, however, it's important to make sure that the drawing page, as it appears in Visio, contains the entire flowchart. Any shapes that hang off the edge of the Visio drawing page will not print. You can see whether the drawing page is large enough for the flowchart by checking the preview on the Page Setup dialog box (File menu, Page Setup, Print Setup tab).
1. A flowchart that is too large for the Visio drawing page.
2. A flowchart that fits the Visio drawing page.
Make your Visio drawing page fit your flowchart
-
With your flowchart open, on the File menu click Page Setup.
-
Click the Page Size tab.
-
Under Page size click Size to fit drawing contents.
To see how the flowchart will print, look at the Print Preview, which is on the File menu. The figure below shows a flowchart that prints on four pieces of letter-sized paper.
Print a large flowchart onto multiple pieces of paper
-
On the File menu, click Page Setup.
-
On the Print Setup tab, in the Printer paper box, select the paper size you want if it isn't already selected. Don't click OK yet.
-
On the Page Size tab, click Size to fit drawing contents. The preview now shows the difference between the new page and the printer paper.
-
Click OK.
-
On the File menu, click Print Preview to see how the flowchart will print.
Note: If there are shaded margins between the pages, they mark areas that print on both pieces of paper so that when you assemble the pieces there are no gaps in the flowchart.
-
After the drawing is printed, you can trim the margins, overlap the pages, and tape them together.
No comments:
Post a Comment