Create a Venn diagram
You can create a SmartArt graphic that uses a Venn diagram layout in Excel, Outlook, PowerPoint, and Word. Venn diagrams are ideal for illustrating the similarities and differences between several different groups or concepts.
Overview of Venn diagrams
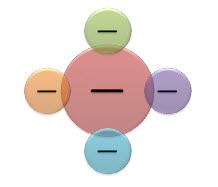
A Venn diagram uses overlapping circles to illustrate the similarities, differences, and relationships between concepts, ideas, categories, or groups. Similarities between groups are represented in the overlapping portions of the circles, while differences are represented in the non-overlapping portions of the circles.

1 Each large group is represented by one of the circles.
2 Each overlapping area represents similarities between two large groups or smaller groups that belong to the two larger groups.
What do you want to do?
Create a Venn diagram
-
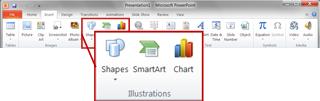
On the Insert tab, in the Illustrations group, click SmartArt.
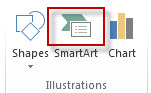
An example of the Illustrations group on the Insert tab in PowerPoint 2013
-
In the Choose a SmartArt Graphic gallery, click Relationship, click a Venn diagram layout (such as Basic Venn), and then click OK.
 Basic Venn layout
Add text to a Venn diagram
Add text to the main circles
-
Select a shape in the SmartArt graphic.
-
Do one of the following:
-
In the Text pane, click [Text] in the pane, and then type your text (or select a bullet and type your text).
-
Copy text from another location or program, click [Text] in the Text pane, and then paste your text.
-
Click a circle in the SmartArt graphic, and then type your text.
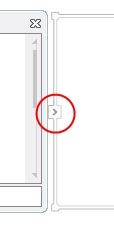
Note: If you do not see the Text pane, you can open it by clicking the control on the left side of the SmartArt graphic.
-
Add text to the overlapping portions of the circles
You cannot add text to the overlapping portions of a Venn diagram from the Text pane. Instead, you can insert text boxes and position them over the overlapping areas.
In Excel, Outlook, and Word:
-
On the Insert tab, in the Text group:
-
In Excel click Text Box.
-
In Outlook, click Text Box, and then click Draw Text Box.
-
In Word, click Text Box, and then at the bottom of the gallery, click Draw Text Box.
-
-
Then do the following:
-
Click and drag in an overlapping circle. Draw the text box the size you want.
-
To add text, click inside the box and type.
-
To change the background color from white to the color of the overlapping circle, right-click the text box, and then select Format Shape.
-
In the Format Shape pane, under Fill, select No fill.
-
To delete the lines around the text box, with the text box still selected, click Line in the Format Shape pane, and then select No line.
Notes:
-
To position the text box, click it, and then when the pointer becomes crossed arrows (
 ), drag the text box to where you want it.
 -
To format text in the text box, select the text, and then use the formatting options in the Font group on the Home tab.
-
-
In PowerPoint:
-
On the Insert tab, in the Text group, click Text Box.
-
Click and drag in an overlapping circle. Draw the text box the size you want.
-
To add text, click inside the box and type.
Add or delete circles in your Venn diagram
-
Click the existing circle that is located closest to where you want to add the new circle.
-
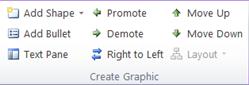
Under SmartArt Tools, on the Design tab, in the Create Graphic group, click the arrow next to Add Shape.
If you don't see the SmartArt Tools or Design tabs, make sure that you've selected the SmartArt graphic. You may need to double-click the SmartArt graphic in order to open the Design tab.
-
Do one of the following:
-
To insert a circle after the selected circle, that will overlap the selected circle, click Add Shape After.
-
To insert a circle before the selected circle, that will overlap the selected circle, click Add Shape Before.
-
Notes:
-
When you want to add a circle to your Venn diagram, experiment with adding the shape before or after the selected circle to get the placement you want for the new circle.
-
To add a circle from the Text pane, click an existing circle, move your pointer before or after the text where you want to add the circle, and then press Enter.
-
To delete a circle from your Venn diagram, click the circle you want to delete, and then press Delete.
Move a circle in your Venn diagram
-
To move a circle, click the circle, and then drag it to its new location.
-
To move a circle in very small increments, hold down CTRL while you press the arrow keys on your keyboard.
Change to a different Venn diagram layout
-
Right-click the Venn diagram that you want to change
-
Click a layout option in the Layouts group on the Design tab under SmartArt Tools. When you point to a layout option, your SmartArt graphic changes to show you a preview of how it would look with that layout. Choose the layout that you want.
-
To show overlapping relationships in a sequence, click Linear Venn.
-
To show overlapping relationships with an emphasis on growth or gradation, click Stacked Venn.
-
To show overlapping relationships and the relationship to a central idea, click Radial Venn.
-
Change the colors of your Venn diagram
To quickly add a designer-quality look and polish to your SmartArt graphic, you can change the colors of your Venn diagram. You can also add effects, such as glows, soft edges, or 3-D effects.
You can apply color combinations that are derived from the theme colors to the circles in your SmartArt graphic.
Click the SmartArt graphic whose color that you want to change.
-
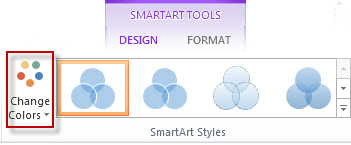
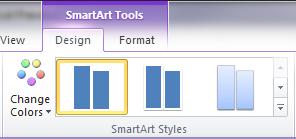
Under SmartArt Tools, on the Design tab, in the SmartArt Styles group, click Change Colors.
If you don't see the SmartArt Tools or Design tabs, make sure that you've selected the SmartArt graphic.
Tip: When you position your pointer over a thumbnail, you can see how the colors affect your SmartArt graphic.
Change the line color or style of a circle's border
-
In the SmartArt graphic, right-click the border of the circle you want to change, and then click Format Shape.
-
In the Format Shape pane, if necessary, click the arrow next to Line to expose all the options, and then do one of the following:
-
To change the color of the circle's border, click Color
 , and then click the color that you want.
 -
To change the line style of the circle's border, select the line styles that you want, such as Transparency, Width, or Dash Type.
-
Change the background color of a circle in your Venn diagram
Click the SmartArt graphic that you want to change.
-
Right-click the border of a circle, and then click Format Shape.
-
In the Format Shape pane, under Fill, click Solid fill.
-
Click Color
, and then click the color that you want.-
To change the background to a color that is not in the theme colors, click More Colors, and then either click the color that you want on the Standard tab or mix your own color on the Custom tab. Custom colors and colors on the Standard tab are not updated if you later change the document theme.
-
To increase the transparency of the shapes in the diagram, move the Transparency slider or enter a number in the box next to the slider. You can vary the percentage of transparency from 0% (fully opaque, the default setting) to 100% (fully transparent).
-
Apply a SmartArt Style to your Venn diagram
A SmartArt Style is a combination of various effects, such as line style, bevel, or 3-D rotation that you can apply to the circles in your SmartArt graphic to create a unique look.
Click the SmartArt graphic that you want to change.
-
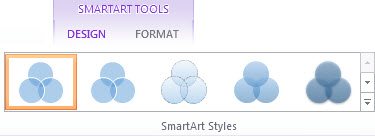
Under SmartArt Tools, on the Design tab, in the SmartArt Styles group, click the SmartArt Style that you want.
To see more SmartArt Styles, click the More button
 .
.
Note: When you position your pointer over a thumbnail, you can see how the SmartArt Style affects your SmartArt graphic.
Tip: If you're using PowerPoint 2013 or PowerPoint 2016, you can animate your Venn diagram to emphasize each circle. For more information, see Animate a SmartArt graphic.
See Also
Learn more about SmartArt Graphics
Change the color of a shape, shape border, or entire SmartArt graphic
What do you want to do?
Create a Venn diagram
-
On the Insert tab, in the Illustrations group, click SmartArt.
-
In the Choose a SmartArt Graphic gallery, click Relationship, click a Venn diagram layout (such as Basic Venn), and then click OK.
Add text to a Venn diagram
Add text to the main circles
-
Select the SmartArt graphic.
-
Under SmartArt Tools, on the Design tab, in the Create Graphic group, click Text Pane.
If you do not see SmartArt Tools or the Design tab, make sure that you have selected a SmartArt graphic. You may need to double-click the SmartArt graphic to open the Design tab. -
Do one of the following:
-
Click [Text] in the Text pane, and then type your text.
-
Copy text from another location or program, click [Text] in the Text pane, and then paste your text.
-
Click a circle in the SmartArt graphic, and then type your text.
-
In the Text pane, under Type your text here, select a bullet and type your text.
Note: You can also open the Text pane by clicking the control.
Add text to the overlapping portions of the circles
You cannot add text to the overlapping portions of a Venn diagram from the Text pane. Instead, you can insert text boxes and position them over the overlapping areas.
To insert a text box, do the following:
-
On the Insert tab, in the Text group, click Text Box.
-
Drag to draw a text box.
-
Select the text box and type your text.
-
Position the text box over the overlapping area of the circles.
Add or delete circles in your Venn diagram
-
Click the SmartArt graphic that you want to add another circle to.
-
Click the existing circle that is located closest to where you want to add the new circle.
-
Under SmartArt Tools, on the Design tab, in the Create Graphic group, click the arrow next to Add Shape.
If you don't see the SmartArt Tools or Design tabs, make sure that you've selected the SmartArt graphic. You may need to double-click the SmartArt graphic in order to open the Design tab.
-
Do one of the following:
-
To insert a circle after the selected circle, that will overlap the selected circle, click Add Shape After.
-
To insert a circle before the selected circle, that will overlap the selected circle, click Add Shape Before.
-
-
When you want to add a circle to your Venn diagram, experiment with adding the shape before or after the selected circle to get the placement you want for the new circle.
-
To add a circle from the Text pane, click an existing circle, move your pointer before or after the text where you want to add the circle, and then press ENTER.
-
To delete a circle from your Venn diagram, click the circle you want to delete, and then press DELETE.
Move a circle in your Venn diagram
-
To move a circle, click the circle, and then drag it to its new location.
-
To move a circle in very small increments, hold down CTRL while you press the arrow keys on your keyboard.
Change to a different Venn diagram layout
-
Right-click the Venn diagram that you want to change, and then click Change Layout.
-
In the Choose a SmartArt Graphic dialog box, click Relationship in the left pane, and in the right pane do one of the following:
-
To show overlapping relationships in a sequence, click Linear Venn.
-
To show overlapping relationships with an emphasis on growth or gradation, click Stacked Venn.
-
To show overlapping relationships and the relationship to a central idea, click Radial Venn.
-
Note: You can also change the layout of your SmartArt graphic by clicking a layout option in the Layouts group on the Design tab under SmartArt Tools. When you point to a layout option, your SmartArt graphic changes to show you a preview of how it would look with that layout.
Change the colors of your Venn diagram
To quickly add a designer-quality look and polish to your SmartArt graphic, you can change the colors of your Venn diagram. You can also add effects, such as glows, soft edges, or 3-D effects.
You can apply color combinations that are derived from the theme colors to the circles in your SmartArt graphic.
Click the SmartArt graphic whose color that you want to change.
-
Under SmartArt Tools, on the Design tab, in the SmartArt Styles group, click Change Colors.
If you don't see the SmartArt Tools or Design tabs, make sure that you've selected the SmartArt graphic.
Tip: When you position your pointer over a thumbnail, you can see how the colors affect your SmartArt graphic.
Change the line color or style of a circle's border
-
In the SmartArt graphic, right-click the border of the circle you want to change, and then click Format Shape.
-
In the Format Shape dialog box, do one of the following:
-
To change the color of the circle's border, click Line Color in the left pane, in the Line Color pane, click Color
, and then click the color that you want. -
To change the line style of the circle's border, click Line Style in the left pane, in the Line Style pane, and then select the line styles that you want.
-
Change the background color of a circle in your Venn diagram
Click the SmartArt graphic that you want to change.
-
Right-click the border of a circle, and then click Format Shape.
-
In the Format Shape dialog box, in the left pane click Fill, and then in the Fill pane click Solid fill.
-
Click Color
, and then click the color that you want.-
To change the background to a color that is not in the theme colors, click More Colors, and then either click the color that you want on the Standard tab or mix your own color on the Custom tab. Custom colors and colors on the Standard tab are not updated if you later change the document theme.
-
To increase the transparency of the shapes in the diagram, move the Transparency slider or enter a number in the box next to the slider. You can vary the percentage of transparency from 0% (fully opaque, the default setting) to 100% (fully transparent).
-
Apply a SmartArt Style to your Venn diagram
A SmartArt Style is a combination of various effects, such as line style, bevel, or 3-D rotation that you can apply to the circles in your SmartArt graphic to create a unique look.
Click the SmartArt graphic that you want to change.
-
Under SmartArt Tools, on the Design tab, in the SmartArt Styles group, click the SmartArt Style that you want.
To see more SmartArt Styles, click the More button
.
-
When you position your pointer over a thumbnail, you can see how the SmartArt Style affects your SmartArt graphic.
Animate your Venn diagram
If you're using PowerPoint 2010, you can animate your Venn diagram to emphasize each circle. For more information about how to animate a SmartArt graphic, see Animate your SmartArt graphic.
-
Click the Venn diagram that you want to animate.
-
On the Animations tab, in the Animation group, click the More button
, and then click the animation that you want. -
To make each circle in the Venn diagram enter in sequence, on the Animations tab, in the Animation group, click Effect Options, and then click One by One.
Note: If you copy a Venn diagram that has an animation applied to it to another slide, the animation is also copied.
See Also
What do you want to do?
Create a Venn diagram
-
On the Insert tab, in the Illustrations group, click SmartArt.
-
In the Choose a SmartArt Graphic gallery, click Relationship, click a Venn diagram layout (such as Basic Venn), and then click OK.
-
To enter text to define a circle, do one of the following:
-
Click [Text] in the Text pane, and then type your text.
-
Copy text from another location or program, click [Text] in the Text pane, and then paste your text.
Note: If the Text pane is not visible, click the control.
-
Click a circle in the SmartArt graphic, and then type your text.
-
Add or delete circles in your Venn diagram
-
Click the SmartArt graphic that you want to add another circle to.
-
Click the existing circle that is located closest to where you want to add the new circle.
-
Under SmartArt Tools, on the Design tab, in the Create Graphic group, click the arrow under Add Shape.
If you don't see the SmartArt Tools or Design tabs, make sure that you've selected the SmartArt graphic.
-
Do one of the following:
-
To insert a circle after the selected circle, that will overlap the selected circle, click Add Shape After.
-
To insert a circle before the selected circle, that will overlap the selected circle, click Add Shape Before.
-
-
When you need to add a circle to your Venn diagram, experiment with adding the shape before or after the selected circle to get the placement you want for the new circle. It's simple to fix common SmartArt mistakes.
-
To add a circle from the Text pane, click an existing circle, move your cursor before or after the text where you want to add the circle, and then press ENTER.
-
To delete a circle from your Venn diagram, click the circle you want to delete, and then press DELETE.
Move a circle in your Venn diagram
-
To move a circle, click the circle, and then drag it to its new location.
-
To move a circle in very small increments, hold down CTRL while you press the arrow keys on your keyboard.
Change to a different Venn diagram layout
-
Right-click the Venn diagram that you want to change, and then click Change Layout.
-
Click Relationship, and then do one of the following:
-
To show overlapping relationships in a sequence, click Linear Venn.
-
To show overlapping relationships with an emphasis on growth or gradation, click Stacked Venn.
-
To show overlapping relationships and the relationship to a central idea, click Radial Venn.
-
Note: You can also change the layout of your SmartArt graphic by clicking a layout option in the Layouts group on the Design tab under SmartArt Tools. When you point to a layout option, your SmartArt graphic changes to show you a preview of how it would look with that layout.
Change the colors of your Venn diagram
To quickly add a designer-quality look and polish to your SmartArt graphic, you can change the colors or apply a SmartArt Style to your Venn diagram. You can also add effects, such as glows, soft edges, or 3-D effects. Using PowerPoint 2007 presentations, you can animate your Venn diagram.
You can apply color combinations that are derived from the theme colors to the circles in your SmartArt graphic.
-
Click the SmartArt graphic whose color you want to change.
-
Under SmartArt Tools, on the Design tab, in the SmartArt Styles group, click Change Colors.
If you don't see the SmartArt Tools or Design tabs, make sure that you've selected the SmartArt graphic.
Tip: When you place your pointer over a thumbnail, you can see how the colors affect your SmartArt graphic.
Change the line color or style of a circle's border
-
In the SmartArt graphic, right-click the border of the circle you want to change, and then click Format Shape.
-
To change the color of the circle's border, click Line Color, click Color
, and then click the color that you want. -
To change the style of the circle's border, click Line Style, and then choose the line styles you want.
Change the background color of a circle in your Venn diagram
-
Click the SmartArt graphic you want to change.
-
Right-click the border of a circle, and then click Format Shape.
-
Click Fill, and then click Solid fill.
-
Click Color
, and then click the color that you want.
To change the background to a color that is not in the theme colors, click More Colors, and then either click the color that you want on the Standard tab or mix your own color on the Custom tab. Custom colors and colors on the Standard tab are not updated if you later change the document theme.
To specify how much you can see through the background color, move the Transparency slider, or enter a number in the box next to the slider. You can vary the percentage of transparency from 0% (fully opaque, the default setting) to 100% (fully transparent).
Apply a SmartArt Style to your Venn diagram
A SmartArt Style is a combination of various effects, such as line style, bevel, or 3-D, that you can apply to the circles in your SmartArt graphic to create a unique and professionally designed look.
-
Click the SmartArt graphic you want to change.
-
Under SmartArt Tools, on the Design tab, in the SmartArt Styles group, click the SmartArt Style that you want.
To see more SmartArt Styles, click the More button
.
-
When you place your pointer over a thumbnail, you can see how the SmartArt Style affects your SmartArt graphic.
-
You can also customize your SmartArt graphic by moving circles, resizing circles, adding a fill or effect, and adding a picture.
Animate your Venn diagram
If you're using Microsoft Office PowerPoint 2007, you can animate your Venn diagram to emphasize each circle.
-
Click the Venn diagram that you want to animate.
-
On the Animations tab, in the Animations group, click Animate, and then click One by one.
Note: If you copy a Venn diagram that has an animation applied to it to another slide, the animation is also copied.
No comments:
Post a Comment