Change the style and width of lines connecting SmartArt shapes
In SmartArt layouts that include connecting lines, such as Organization Charts or Radial Lists, you can change the color, style, and width of the lines connecting the shapes. You can also add effects, such as shadows and glows, to your lines.
Change the color, width, or style of a line
-
Select the line within the SmartArt graphic.
To change multiple lines, click the first line, and then press and hold CTRL while you click the additional lines.
-
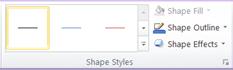
Under SmartArt Tools, on the Format tab, in the Shape Styles group, click the arrow next to Shape Outline.
If you do not see the SmartArt Tools or Format tabs, make sure that you selected a SmartArt graphic. You might have to double-click the SmartArt to open the Format tab.
-
Do one of the following:
-
Select a color from Theme Colors or Standard Colors. Standard are not changed when you change the file theme.
Tip: To customize your line even further, click More Outline Colors, and then select the exact shade and transparency that you want. Custom colors are also not change when you change the file theme.
-
Click Weight, and then select a width for the line., or click More Lines to specify your own width.
-
Click Dashes, and then select a line style from the list, or click More Lines to create your own style.
-
Click Arrows, and then select an arrow head from the list, or click More Arrows to customize the arrow.
Tip: Use dotted lines in a hierarchy or radial diagram to show different types of relationship.
-
-
Click Close.
Apply an effect to a line
-
Select the line within the SmartArt graphic.
To change multiple lines, click the first line, and then press and hold CTRL while you click the additional lines.
-
Under SmartArt Tools, on the Format tab, in the Shape Styles group, click the arrow next to Shape Effects.
The Format tab under SmartArt Tools.If you do not see the SmartArt Tools or Format tabs, make sure that you selected a SmartArt graphic. You might have to double-click the SmartArt to open the Format tab.
-
Select an effect from the list.
-
Click Close.
This is an informative blog. Keep it up. I am looking forward to this kind of blog. Thanks for sharing it with us.
ReplyDeleteoutlook bellen nederland