Use the sales pipeline and sales funnel gadgets
Business Contact Manager for Outlook 2010 provides you with tools that help you visualize the state of your business. These tools include the Sales Funnel and Sales Pipeline gadgets, which represent data from your Opportunity records in graphic format.
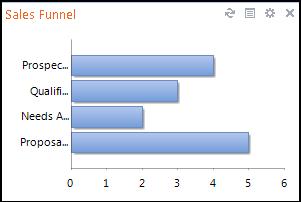
The Sales Funnel gadget presents a "snapshot" of your sales outlook. It charts how many opportunities are at each sales stage so that you can identify any potential slowdowns, and decide where the team should focus its attention to keep sales at the desired level.
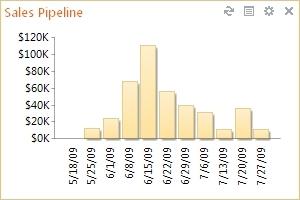
While the Sales Funnel identifies how opportunities are moving through your sales process, the Sales Pipeline shows how close you are to achieving your sales goals by charting the progress (as measured by criteria such as targeted close dates, or revenue) for your open opportunities.
To view data in sales gadgets, create an Opportunity record for every sales opportunity, and keep the records current with information about sales stages and deadlines.
This article will focus on viewing and interpreting the Sales Funnel and Sales Pipeline gadgets.
What do you want to do?
View and interpret the Sales Funnel gadget
In the Navigation Pane, under Business Contact Manager, click Sales. The Sales Funnel gadget appears in the upper portion of the workspace.
Tips:
-
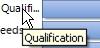
Hover over labels to display the full text of the label.
-
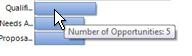
Hover over bars in the chart to display the specific data represented.
To interpret the Sales Funnel, note the following details:
-
Each bar represents a different stage in the sales process.
-
The length of the bar can represent one of these factors: the number of opportunities, the potential revenue (money from sales), or the gross margin (the difference between total revenue and the cost of goods sold).
View and interpret the Sales Pipeline gadget
In the Navigation Pane, under Business Contact Manager, click Sales. The Sales Pipeline gadget appears in the upper portion of the workspace.
To interpret the Sales Pipeline, note the following details:
-
The Sales Pipeline is an aggregate view of the open sales opportunities based on a close date. For instance, in the illustration above, the number of open sales opportunities slated to close by 6/15/09 represents potential revenue of about $115,000.
-
Each bar represents a week, a month, or a quarter.
-
The length of the bar can represent one of these factors: the number of opportunities; the potential revenue (money from sales, in thousands); or the gross margin (the difference between total revenue and the cost of goods sold).
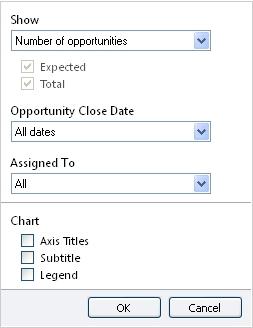
Change the information that is displayed in the Sales gadgets
-
In the gadget, click the Options button
 .
.The Options pane appears.
-
In the Show field, select the information you want to display:
-
Number of opportunities. Displays how many opportunities are at each of the sales stages (Sales Funnel) or time frames (Sales Pipeline).
-
Revenue. Displays the potential revenue each sales stage or time frame contains. You can then choose to display the Expected revenue, the Total revenue, or both.
-
Gross margin. Displays the potential gross margin of each sales stage or time frame. Gross margin is equal to the total earnings minus the expenses involved in producing the product or service. You can then choose to display the Expected gross margin, the Total gross margin, or both.
-
-
Select a time frame.
-
For the Sales Funnel, you can view information by the time frame in which the Opportunity will close, 30, 90, 180, or 365 days.
-
For the Sales Pipeline, you can view information by the time interval you choose, a week, a month, or a quarter.
-
-
Filter the data for a particular employee by clicking the name in the Assigned To list.
Note: Employees included in this list are those with whom you have shared your database.
-
Add labels to the gadget.
-
Axis Titles. Displays the labels for the X and Y axes.
-
Subtitle. Displays a label for the type of data that is displayed in the chart. For example, Revenue from Opportunities.
-
Legend. Provides an explanation of what the bars represent.
-
Are you trying to find the simplest sales funnel software for your business? have you ever been thinking what to choose between Clickfunnels and Builderall?
ReplyDeleteAwesome blog. I enjoyed reading your articles. This is truly a great read for me. I have bookmarked it and I am looking forward to reading new articles. Keep up the good work!
ReplyDeleteOne Funnel Away Platinum
The Most Affordable And Easiest User Friendly Page Builder You Will Ever Use!
ReplyDeleteYour donation does make a difference in the daily struggles of the many families we serve! donate ukraine Support our organization by becoming a sponsor or sponsor services for families in need.
ReplyDeleteYou just solve my problem of sales funnel. Thank you for saving the day!
ReplyDeleteI also got help from here https://bloggvalley.com/manage-ad-campaigns-and-sales-funnels/ . Click to read more about sales funnel.