Change the display of a 3-D chart
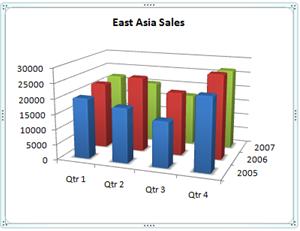
To make a 3-D chart, such as a 3-D column, 3-D line, or 3-D surface chart) easier to read, you can change the 3-D format, rotation, and scaling of the chart.
For charts that display chart elements in 3-D without using a third, depth axis (such as a pie in 3-D, bar in 3-D, or stacked area in 3-D chart), you can change the 3-D format of the 3-D chart elements. However, 3-D rotation and scaling options are not available for the individual chart elements — you can change the 3-D rotation and scaling for the whole chart only.
If smaller data markers are hidden behind larger ones in a 3-D chart, you can reverse the order of the data series that are plotted in the chart, or you can use transparency to improve the visibility of all data markers.
Notes:
-
The examples here are from Excel, though charts are available in Word, PowerPoint, and Outlook as well. If you're using one of these program, the features are the same, but there may be slight differences in getting to the initial charts.
-
The following procedures apply to Office 2013 and newer versions. Office 2010 steps?
Create a 3-D chart
-
On the worksheet, select the cells that contain the data that you want to use for the chart.
-
On the Insert tab, click Charts if you just see the icon, or click a chart you want to use.
You can also click the See all charts icon in the lower right of the Charts section. This opens the Chart dialog, where you can pick any chart type. Each category usually show both 2D and 3D. Choose one.
Change the 3-D format of chart elements
-
On a 3-D chart, click the chart element, such as bars or lines, that you want to change the 3-D format, or do the following to select it from a list of chart elements.
-
Click a chart.
This displays the Chart Tools, adding the Design and Format tabs. -
On the Format tab, in the Current Selection group, click the arrow next to the Chart Elements box, and then click the chart element that you want to use.
-
-
Keyboard shortcut You can, instead, click the chart element for which you want to change the 3-D format, and then press CTRL+1. Continue with step 3.
-
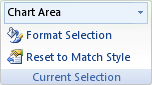
In the Current Selection group, click Format Selection.
-
Click Effects, click 3-D Format, and then select one or more of the following options.
-
Click Top bevel or Bottom bevel and then click the bevel format that you want to use.
In the Width and Height boxes, select the point size that you want to use.
-
Click Material, and then click the effect that you want to use.
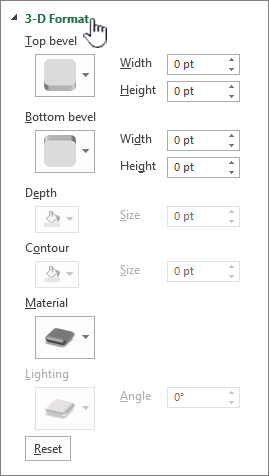
Note: Availability of these options depends on the chart element that you selected. Some options that are presented in this dialog box are not available for all charts.
The settings in this dialog operate on the chart element you select. If you choose the whole chart, it creates frames, while if you chose a data series, it works only on the elements of that series.
-
Change the depth and spacing in a 3-D chart
You can change the chart depth in 3-D charts that have axes, the gap depth in 3-D perspective charts, and the gap width in 3-D bar or column charts.
-
Click the 3-D chart that you want to change.
-
On the Format menu, click Selected Data Series.
-
On the Format Data Series tab, click Series Options, and then select the depth and width options that you want to use.
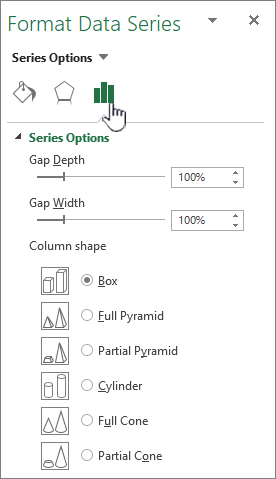
Note: Availability of these options depends on the chart element that you selected. Some options that are presented in this dialog box are not available for charts.
Change the rotation of a 3-D chart
-
Click the chart area of the 3-D chart that you want to rotate, or select Chart area from the Chart elements list under Current Selection on the Format tab.
-
Keyboard shortcut You can, instead, click the chart area, and then press CTRL+1. Continue with step 3.
-
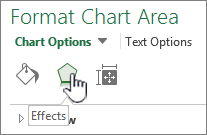
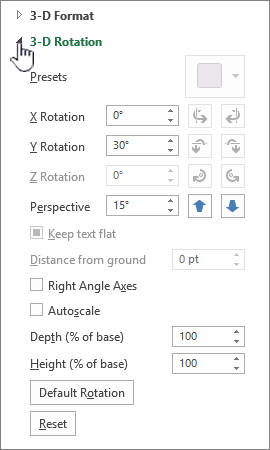
On the Format Chart Area tab, click Effects, and then click 3-D Rotation.
-
Do one or more of the following:
-
To change the rotation, click the degree of rotation that you want in the X Rotation and Y Rotation boxes.
Note: Charts can be rotated around the horizontal and vertical axes but never around the depth axis. Therefore, you cannot specify a degree of rotation in the Z box.
-
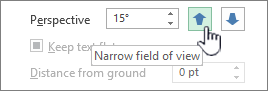
To change the field of view on the chart, click the degree of perspective that you want in the Perspective box, or click the Narrow field of view or Widen field of view buttons until you have reached the result that you want.
Note: Some options that are presented in this dialog box are not available for charts. You cannot reset the options that you changed to previous settings.
-
Change the scale of a 3-D chart
You can change the scale of a 3-D chart by specifying its height and depth as a percentage of the base of the chart.
-
Click the chart area of the 3-D chart that you want to change, or select Chart area from the Chart elements list under Current Selection on the Format tab.
-
Keyboard shortcut You can, instead, click the chart area, and then press CTRL+1. Continue with step 3.
-
On the Format Chart Area dialog, click 3-D Rotation.
-
In the 3-D Rotation properties, do one of the following:
-
To change the depth of the chart, specify the percentage of depth in the Depth (% of base) box.
-
To change both the depth and height of the chart, clear the Autoscale check box, and then specify the percentage of depth and height that you want in the Depth (% of base) and Height (% of base) boxes.
-
To use a right-angle axes view, select the Right Angle Axes check box, and then specify the percentage of depth that you want in the Depth (% of base) box.
-
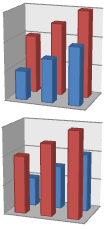
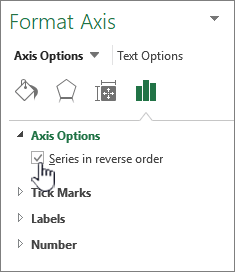
Reverse the order of data series in a 3-D chart
You can change the plotting order of data series so that large 3-D data markers do not block smaller ones.
-
On a chart, click the depth axis, or select Depth axis from the Chart elements list under Current Selection on the Format tab.
-
On the Format tab, in the Current Selection group, click Format Selection.
-
In the Axis Options category, under Axis Options, select the Series in reverse order check box.
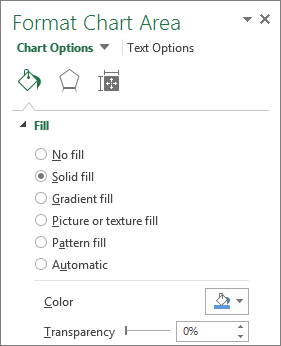
Use transparency in a 3-D chart
Although transparency can be used in 3-D and 2-D charts, it is especially useful in 3-D charts where larger data markers can obscure smaller ones.
-
In a 3-D chart, click the data series or data point that you want to make transparent, or select a data series from the Chart elements list under Current Selection on the Format tab.
-
Keyboard shortcut You can, instead, click the chart element for which you want to change the 3-D format, and then press CTRL+1. Continue with step 3.
-
On the Format tab, in the Current Selection group, click Format Selection.
-
Click Fill & Line, click Fill, and then click Solid fill, Gradient fill, or Picture or texture fill.
-
Click and choose a color if you want to change the colors of the element.
-
Click the handle on the Transparency bar, and then slide it the percentage of transparency that you want to use.
Create a scatter or line chart in Office 2010
Create a 3-D chart (Office 2010)
-
On the worksheet, select the cells that contain the data that you want to use for the chart.
-
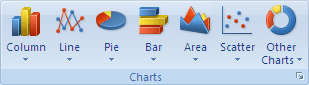
On the Insert tab, in the Charts group, do one of the following:
-
To create a 3-D column chart, click Column, and then under 3-D Column, click 3-D Column.
-
To create a 3-D cylinder chart, click Column, and then under Cylinder, click 3-D Cylinder.
-
To create a 3-D cone chart, click Column, and then under Cone, click 3-D Cone.
-
To create a 3-D pyramid chart, click Column, and then under Pyramid, click 3-D Pyramid.
-
To create a 3-D line chart, click Line, and then under 3-D Line, click 3-D Line.
-
To create a 3-D area chart, click Area, and then under 3-D Area, click 3-D Area.
-
To create a 3-D surface chart, click Other Charts, and then under Surface, click 3-D Surface or Wireframe 3-D Surface.
Tip: A ScreenTip displays the chart type name when you rest the mouse pointer over any chart type or chart subtype. For more information about the chart types that you can use, see Available chart types.
-
Change the 3-D format of chart elements (Office 2010)
-
On a 3-D chart, click the chart element for which you want to change the 3-D format, or do the following to select it from a list of chart elements.
-
Click a chart.
This displays the Chart Tools, adding the Design, Layout, and Format tabs. -
On the Format tab, in the Current Selection group, click the arrow next to the Chart Elements box, and then click the chart element that you want to use.
-
-
Keyboard shortcut You can, instead, click the chart element for which you want to change the 3-D format, and then press CTRL+1. Continue with step 3.
-
On the Layout tab, in the Current Selection group, click Format Selection.
-
Click 3-D Format, and then select one or more of the following options.
-
Under Bevel, click Top and Bottom, and then click the bevel format that you want to use. In the Width and Height boxes, select the point size that you want to use.
-
Under Surface, click Material, and then click the effect that you want to use.
Note: Availability of these options depends on the chart element that you selected. Some options that are presented in this dialog box are not available for charts.
-
Tip: You can also use this procedure to change the 3-D format of chart elements in a 2-D chart.
Change the depth and spacing in a 3-D chart (Office 2010)
You can change the chart depth in 3-D charts that have axes, the gap depth in 3-D perspective charts, and the gap width in 3-D bar or column charts.
-
Click the 3-D chart that you want to change.
-
On the Format menu, click Selected Data Series.
-
On the Options tab, select the depth and width options that you want to use.
Change the rotation of a 3-D chart (Office 2010)
-
Click the chart area of the 3-D chart that you want to rotate, or do the following to select the chart area from a list of chart elements:
-
Click a chart.
This displays the Chart Tools, adding the Design, Layout, and Format tabs. -
On the Format tab, in the Current Selection group, click the arrow next to the Chart Elements box, and then click the chart element that you want to use.
-
-
Keyboard shortcut You can, instead, click the chart area, and then press CTRL+1. Continue with step 3.
-
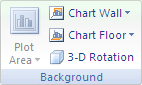
On the Layout tab, in the Background group, click 3-D Rotation.
-
In the 3-D Rotation category, under Rotation, do one or more of the following:
-
To change the rotation, click the degree of rotation that you want in the X and Y boxes.
Note: Charts can be rotated around the horizontal and vertical axes but never around the depth axis. Therefore, you cannot specify a degree of rotation in the Z box.
-
To change the field of view on the chart, click the degree of perspective that you want in the Perspective box, or click the Narrow field of view or Widen field of view buttons until you have reached the result that you want.
Note: Some options that are presented in this dialog box are not available for charts. You cannot reset the options that you changed to previous settings.
-
Change the scale of a 3-D chart (Office 2010)
You can change the scale of a 3-D chart by specifying its height and depth as a percentage of the base of the chart.
-
Click the chart area of the 3-D chart that you want to change, or do the following to select it from a list of chart elements:
-
Click a chart.
This displays the Chart Tools, adding the Design, Layout, and Format tabs. -
On the Format tab, in the Current Selection group, click the arrow next to the Chart Elements box, and then click the chart element that you want to use.
-
-
Keyboard shortcut You can, instead, click the chart area, and then press CTRL+1. Continue with step 3.
-
On the Layout tab, in the Background group, click 3-D Rotation.
-
In the 3-D Rotation category, under Chart Scale, do one of the following:
-
To change the depth of the chart, specify the percentage of depth in the Depth (% of base) box.
-
To change both the depth and height of the chart, clear the Autoscale check box, and then specify the percentage of depth and height that you want in the Depth (% of base) and Height (% of base) boxes.
-
To use a right-angle axes view, select the Right Angle Axes check box, and then specify the percentage of depth that you want in the Depth (% of base) box.
-
Reverse the order of data series in a 3-D chart (Office 2010)
You can change the plotting order of data series so that large 3-D data markers do not block smaller ones.
-
On a chart, click the depth axis, or do the following to select it from a list of chart elements:
-
Click a chart.
This displays the Chart Tools, adding the Design, Layout, and Format tabs. -
On the Format tab, in the Current Selection group, click the arrow next to the Chart Elements box, and then click the chart element that you want to use.
-
-
On the Format tab, in the Current Selection group, click Format Selection.
-
In the Axis Options category, under Axis Options, select the Series in reverse order check box.
Use transparency in a 3-D chart (Office 2010)
Although transparency can be used in 3-D and 2-D charts, it is especially useful in 3-D charts where larger data markers can obscure smaller ones.
-
In a 3-D chart, click the data series or data point that you want to make transparent, or do the following to select it from a list of chart elements:
-
Click a chart.
This displays the Chart Tools, adding the Design, Layout, and Format tabs. -
On the Format tab, in the Current Selection group, click the arrow next to the Chart Elements box, and then click the chart element that you want to use.
-
-
Keyboard shortcut You can, instead, click the chart element for which you want to change the 3-D format, and then press CTRL+1. Continue with step 3.
-
On the Layout tab, in the Current Selection group, click Format Selection.
-
Click Fill, and then click Solid fill, Gradient fill, or Picture or texture fill.
-
Click the handle on the Transparency bar, and then slide the handle to the percentage of transparency that you want to use.
Find out how you can change the rotation or a perspective of a 3-D chart in Word for Mac, PowerPoint for Mac, and Excel for Mac.
Note: The screenshots in the following procedure have been taken in Excel, although the functionality is the same in Word and PowerPoint.
-
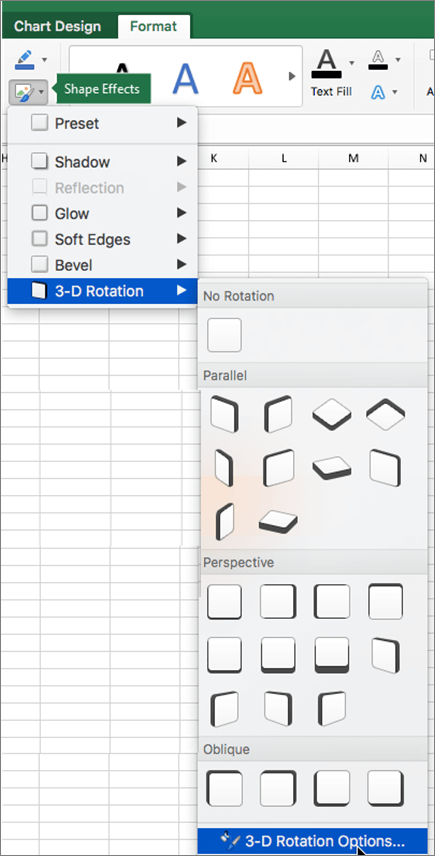
Click the chart, and then click the Format tab on the ribbon.
-
Click Shape Effects, then click 3-D Rotation, and the click 3-D Rotation Options.
-
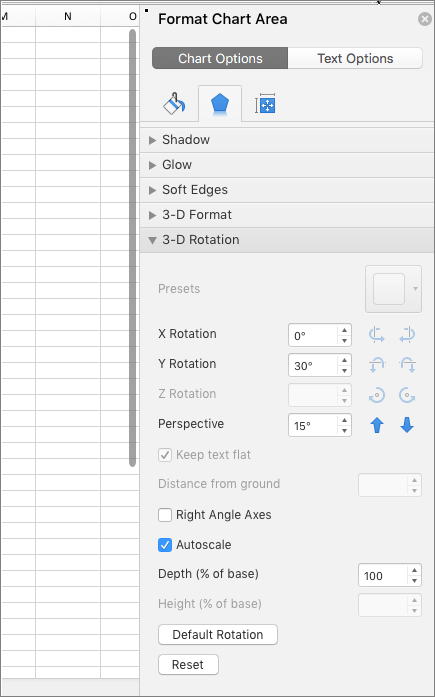
On the Format Chart Area pane, in the 3-D Rotation section, do the following:
-
To change the rotation, in the X Rotation and Y Rotation boxes, enter the degree of rotation.
-
To change the perspective, in the Perspective box, enter the degree of perspective you want. You can also use the
 and
and  arrows to narrow or widen the field of view.
-
No comments:
Post a Comment