
For quick searches and questions, create a basic query to find the data you need and get your answers.
Create a query in Design view
Design view gives you more control over the query you create than the Query Wizard does.
-
Open Query Design view
-
To get started, select Create > Query Design.

-
-
Add data sources
First, add the table or query that contains the data you want to see. (Yes, you can create new queries from saved queries. For example, suppose you built a query that finds all the products from your suppliers and sorts them from highest to lowest sales numbers. Use that query as a data source for a new query that, for example, finds sales of products from suppliers in a specific region.)
-
In the Show Table dialog box, select the Both tab.
-
Select the data sources you want, and, after each source, select Add.
-
Close the dialog box.
-
-
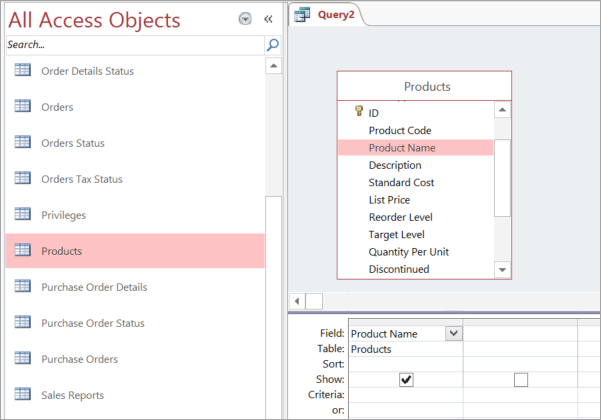
Add output fields
The output fields are the data that you want displayed or included in the result set for the query.
-
Drag the fields you want from the data source in the upper pane down to an empty cell in the Field row in the lower pane.
Use an expression as an output field
To perform calculations or to use a function to produce query output, include an expression as an output field. The expression can use data from any of the query data sources, in addition to functions, such as Format or InStr, and can contain constants and arithmetic operators.
-
In an empty column of the query design grid, select the Field row.
-
On the Design tab, in the Query Setup group, select Builder.
-
Type or paste your expression. Preface your expression with the name you would like to use for the expression output, followed by a colon. For example, to label the expression "Last updated," start your expression with: Last updated:
Alternatively, use Expression Builder to build your expression with Expression Elements, Expression Categories, and Expression Values.
Note: Expressions are powerful and flexible, with many options. For more information, see Build an expression.
-
-
Specify criteria (optional)
Use criteria to limit (to field values) the records that your query returns. For example, you might only want to see the products with a unit price of less than $10.
-
To specify criteria, first drag the fields containing the values into the lower pane.
Tip: By default, when you add a field, its data returns in the query results. If you've added the field you want already, you don't need to add it again to apply criteria to it.
-
If you don't want the field contents to appear in your results, in the Show row for the field, clear the check box.
-
In the Criteria row for the field, type an expression that the field values must satisfy (if the record is to be included in your results). For example, <10. (For more examples, see Examples of query criteria.)
-
Specify any alternate criteria in the Or row, below the Criteria row.
If you specify alternate criteria, records are selected if the field's value meets any of the listed criteria. For example, if you included the State field from your Customers table, specified CA as the criteria, and included Or rows for ID and WA, you get records for customers living in any of the three itemized states.
-
-
Summarize data (optional)
You might want to summarize data, especially if your data is numeric. For example, you might want to see the average price or total sales.
-
If necessary, add the Total row to the query design grid in the lower pane. In Design view, on the Design tab, in the Show/Hide group, select Totals.
-
For each field that you want to summarize, in the Total row, select the function to use. The available functions depend on the data type of the field.
-
-
Run or save the query
-
To run the query, in the Results group, on the Design tab, select Run.
-
To save your query for later use, on the Quick Access Toolbar, select Save
 . Type a descriptive name for the query, and then select OK.
-
Want more?
In this video, you'll learn how to use the Query Designer to create a Select query from the ground up.
You'll select the data source along with fields from that data source.
As needed, you'll add criteria to filter the results, making sure your data types match.
Then you'll run the query and adjust the view of query results to show what you want to see.
Our query will answer this question: "How many orders did TailSpin Toys place last month?"
Let's get started.
On the ribbon, select Create, then Query Design.
This starts the Query Designer.
You can use the Show Table dialog box to add tables or queries as a data source, or you can just drag a source over from the navigation pane.
Let's use the Orders table for our data source. To answer our question, we specifically need customer names and order dates.
You can double-click to add a field to the design grid down here, or you can drag it.
If you run the query now, you can see it returns every order for every customer, and you can use the filtering tools here to narrow the results.
But, if you add criteria to a query, you can get the same result every time.
The thing is, adding criteria gets a little more complicated so keep in mind a couple of rules.
The first rule is: Know your data.
To show you what this means, let's open the Orders table, …
… select Fields on the ribbon, …
… and then select the fields in our query.
The Order Date field is a Date/Time data type field, …
… but the Customers field isn't a Text field; it's a Number data type field.
This leads to the second rule: Your criteria must match the data type of the field you're filtering.
For instance, you can only enter date values in a Date/Time field, numbers in a Number field, and so on.
So, how do we know which number corresponds to TailSpin Toys?
Let's select Database Tools, Relationships. In the Relationships pane, we see Customers in Orders are related by the ID and Customer ID fields.
Let's select Database Tools, Relationships. In the Relationships pane, we see Customers and Orders are related by the ID and Customer ID fields.
When we open the Customers table and locate TailSpin Toys, we see it has an ID value of 23.
Back in the query now, let's enter 23 in the criteria row of the Customer ID field.
Then we expand the Order Date field and add a pair of logical operators: "between" and "and". We enter a starting date here, and an ending date here.
Notice that we surround the date values with pound signs. Access requires these when we want to identify the value as a date and not text.
Run the query, and now we get the results we were looking for: just the orders placed by TailSpin last month.
Now let's go back and look at the Query Designer for a minute.
Do you see these check boxes? If you clear them, you hide your field from the result, like so.
The field is still in the query; you just don't see it in the results.
Also, if you want to return a portion of the result, such as the top five values or maybe the bottom 25 percent of a data set, select a value from the return list.
Then here in the design grid, go to the sort row and select Ascending or Descending. Ascending order returns the bottom items, and Descending returns the top items.
Next, look at the Totals button. This is a fast way to add sums, averages, or other calculations to a query.
Here's an example. You can see we have three tables with a field from each. If I run the query as it is now, we get a lot of repeated categories.
So, back to Design View.
Select Totals, … and notice that Access adds a Total row to the query grid, and sets all three fields to Group By.
Suppose we want to see how many items of each category have been ordered. We remove the Order Date field from the query.
We set the Quantity field to Sum, and leave the Category field on Group By.
And we move the Category field so it's the leftmost field.
Now when we run the query, it calculates the number of items sold in each category.
Sort the results, and you can see which categories sell the most or the least.
Now you've created a Select query by using the Query Designer.
You know how to select your data source and criteria, and also how to run and fine-tune your query results.
No comments:
Post a Comment