Wednesday, February 2, 2022

Video select stuff in powerpoint for ipad

Your browser does not support video. Install Microsoft Silverlight, Adobe Flash Player, or Internet Explorer 9.

Other tutorial videos for PowerPoint for iPad:

  1. Open files from the cloud. Open files from OneDrive for Business (for your work or school stuff), OneDrive.com (for your personal stuff), or from a Dropbox account.

  2. Open email attachments. Open, edit, and send back email attachments using PowerPoint for iPad.

  3. How saving works in PowerPoint for iPad. PowerPoint for iPad automatically saves your work every time you make even a small change. In most cases, you don't have to do anything at all to save your document. Watch this training video to learn about AutoSave.

  4. Type in PowerPoint for iPad. Typing in PowerPoint for iPad can be tricky at first, especially if you're used to a physical keyboard. This training video shows you some typing tips.

  5. Select stuff in PowerPoint for iPad. (You are here!) Select text and pictures expertly with your finger in PowerPoint for iPad. This training video helps you move from the mouse to the touchscreen.

  6. How to print in PowerPoint for iPad. You tap the File button to print in PowerPoint for iPad. Watch this video to learn how. At this time, you can only print to an AirPrint compatible printer.

  7. Run a slideshow in PowerPoint for iPad. There are some special finger gestures you can use to advance, go back, and end a slideshow. You can even use a laser pointer and ink pen, with the touch of your finger.

  8. Projecting your slideshow to a screen. If you want to project a slideshow from your iPad to a screen or TV, then watch this video. It will show you how to hook up an adaptor. You can also use AirPlay.

Looking for more training?

Create a diagram in excel with the visio data visualizer add in

Create stunning, high-quality diagrams with the Visio Data Visualizer add-in for Excel with a Microsoft 365 work or school account.

You can create basic flowcharts, cross-functional flowcharts, and organizational charts. The diagrams are drawn automatically from data in an Excel workbook. If you then edit the diagram in Visio, your changes are synced back to Excel.

This means you don't need a Visio subscription to make stunning diagrams in Excel. View, print, or share your diagrams with others for free in the web version of Visio. For additional editing capabilities, you need either a Visio Plan 1 or Visio Plan 2 subscription.

Note: The Visio Data Visualizer add-in is supported in all the languages supported by Visio for the web. A complete list of the languages is shown at the end of this article.

Start with the Visio Data Visualizer add-in

The Data Visualizer add-in is available for Excel on PC, Mac, and the browser with a Microsoft 365 work or school account. 

(If the only Microsoft account you have is a personal one—that is, hotmail.com, live.com, outlook.com, or msn.com—you can still try out parts of the Data Visualizer add-in without signing in. It just means that the features available to you are somewhat limited. Read The Data Visualizer add-in is designed for Microsoft 365 work and school accounts for more details.) 

  1. Open Excel and create a new Blank workbook.

  2. Save the workbook to a OneDrive or SharePoint location for seamless sharing and the optimal experience. You can also save your file locally to your computer.

  3. Ensure that an empty cell is selected in the workbook.

  4. Select Insert > Get Add-ins or Add-ins. In the Office Add-ins Store, search for "Data Visualizer", and then select Add. If you see a security message regarding the add-in, select Trust this add-in.

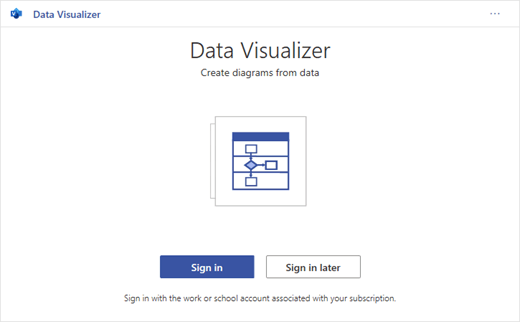
  5. Sign in with the account associated with your Microsoft 365 work or school subscription, or select Sign in later.

    In the add-in, we no longer support manual sign-in ("ADAL"). But we automatically detect your identity and sign you in. If we can't sign you in, it means your version of Excel doesn't work with the add-in. You can fix this by using Excel for the web or upgrading to Excel for Microsoft 365.  

    Note: When you're signed in, you unlock capabilities in Visio for the web such as printing, sharing, and viewing in the browser. You don't need a Visio subscription to use this add-in, but if you have one, you'll also be able to make edits to your diagram.

    If you see a permissions prompt, select Allow.

    Sign in with your account or sign in later.

As an alternative to the procedure above, you can download our add-in ready templates to get started in Excel:

Modify the data-linked table to customize your diagram

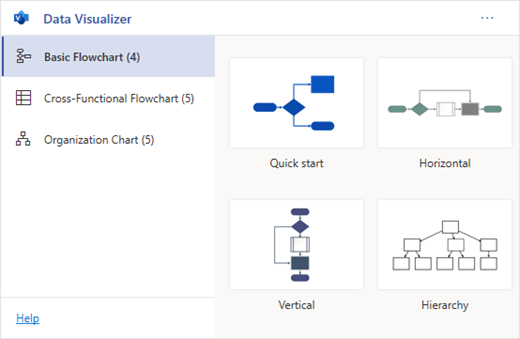
  1. Choose a diagram type and then select the template you'd like to work with. This will insert a sample diagram and its data-linked table. That process may take a minute. The templates come with different layout and theme options that can be further customized in Visio.

    The Data Visualizer add-in has several types of diagrams to choose from.

  2. If you're signed in, the diagram is saved as a Visio file in your OneDrive or SharePoint location. If you're not signed in, then the diagram is part of your Excel workbook instead. You can always choose to create a Visio file by signing in.

  3. To create your own diagram, modify the values in the data table. For example, you can change the shape text that will appear, the shape types, and more by changing the values in the data table.

    For more information, see the section How the data table interacts with the Data Visualizer diagram below and select the tab for your type of diagram.

  4. Add or remove shapes for steps or people by adding or removing rows in the data table.

  5. Connect shapes to design the logic of your diagram by entering the IDs of the connected shapes in the corresponding table column for your diagram type.

  6. After you've finished modifying the data table, select Refresh in the diagram area to update your visualization.

    Note: If there is an issue with the source data table, the Data Checker will appear with instructions on how to fix the issue. After you modify the table, select Retry in the Data Checker to confirm the issue is resolved. Then you'll see the updated diagram.

Tips for modifying the data table

  • Save the Excel workbook (if you're working in the Visio client) and Refresh frequently.

  • Consider sketching out the logic of your diagram on paper first. This may make it easier to translate into the data table.

View, print, or share your Visio diagram

You can open the Data Visualizer flowchart in Visio for the web to view, print, or share your diagram with others. Learn how:

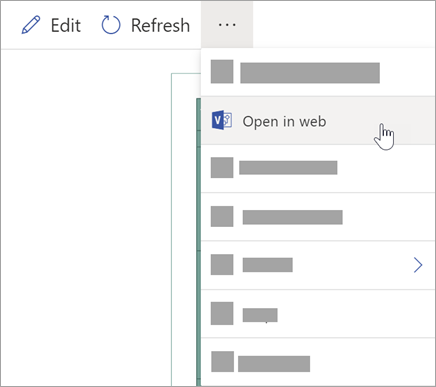
  1. To view the diagram outside of Visio for the web, select the ellipses (. . .) in the diagram area and select Open in web.

    Note: If you're not signed in yet, you'll be prompted to sign in with your Microsoft 365 work or school account.* Select Sign in and then Allow or Accept on any permission prompts.

  2. After the Visio file is created, select Open file.

  3. In Visio for the web, select the ellipses (. . .) > Print to print your diagram.

  4. To share your diagram, select the Share button to create a link or to enter the email addresses of those you want to share with.

Select the ellipses (...) for more options and then select Open on the web.

Edit the diagram with a Visio subscription

If you have a subscription to Visio, you can do more with the diagram. Add text or images, apply design themes, and make other modifications to customize the diagram. 

Do basic editing with Visio for the web

Use Visio for the web for basic editing in the browser, such as changing themes, modifying layouts, formatting shapes, adding text boxes, etc.

  1. In the diagram area in Excel, select Edit The Edit button in the Data Visualizer add-in for Excel..

    Note: If you're not signed in yet, you'll be prompted to sign in with your Microsoft 365 or Microsoft 365 work or school account. Select Sign in and then Allow or Accept on any permission prompts.

  2. Make your changes to the diagram in Visio for the web.

    To do this

    Use

    Add and format text

    Home > Font options:

    The Font options on the Home tab in Visio for the web.

    For more details, see Add and format text.

    Change the theme

    Design > Themes Themes icon

    Design > Theme Colors Themes Colors icon

    For more details, see Apply a theme or theme color.

    Change the diagram's layout

    Design > Layout The Layout button.

    For more details, see Re-layout a diagram.

    If you want to add or modify a shape while still keeping the source data in sync, then edit the diagram with the Visio desktop app. Such changes made in Visio for the web can't by synced back to the Excel source file. 

  3. When you're done editing the diagram, go back to the Excel file and select Refresh The Refresh button in the Data Visualizer add-in for Excel. to see your changes.

Do advanced editing with the Visio app

Use the Visio desktop app for advanced edits, such as adding new shapes, modifying connections, and other changes to the structure of the diagram. The Visio app supports two-way sync, so any changes you make can be synced back to your Excel workbook where you can see your diagram changes after refreshing.

Note: To edit in the Visio app, you need a Visio Plan 2 subscription.

  1. In the diagram area in Excel, select Edit.

  2. Save and close your Excel file.

    To edit in the Visio app and successfully sync changes, the Excel file with the data table and diagram must be closed.

  3. In Visio for the web select Edit in Desktop App in the ribbon.

  4. Select Open to confirm. If you receive a security warning asking if this Visio file is a trusted document, select Yes.

  5. Make your changes to the diagram in the Visio app.

  6. When you're done, select the diagram container to see the Data Tools Design tab in the ribbon, and then select Update Source Data.

    Select the diagram, under Data Tools Design select Update Source Data.

    Note: If you try to update the source data and the link to the Visio data is broken, Visio prompts you to relink. Select the diagram area in Visio, and under the Data Tools Design tab select Relink Source Data. Browse to the Visio workbook with the source table, select Relink, then Update Source Data again.

  7. Now that your data has synced back to your Excel workbook, save your Visio file—preferably in the same location as your Excel file.) Close the Visio file.

  8. Open the Excel file and select Refresh in the diagram area to see your changes.

    Note: If you run into a Refresh Conflict, you can refresh the diagram. You'll lose any edits you've made, but any formatting changes to the shapes or connectors inside the container are preserved.

Microsoft 365 subscribers who have Visio Plan 2 can use Data Visualizer templates to get more advanced diagramming features, such as those listed below. See Create a Data Visualizer diagram for more details:

  • Create a diagram using custom stencils

  • Create sub-processes

  • Bring your diagram to life with data graphics

  • Have two-way synchronization between the data and the diagram

How the data table interacts with the Data Visualizer diagram

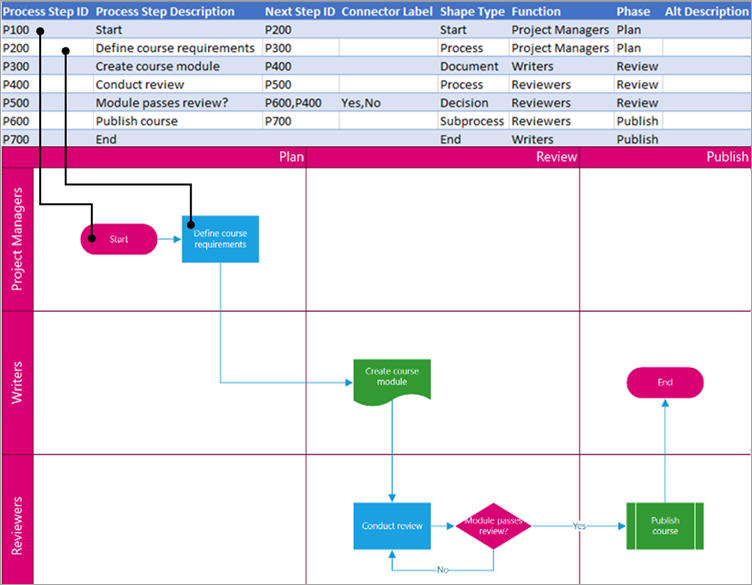
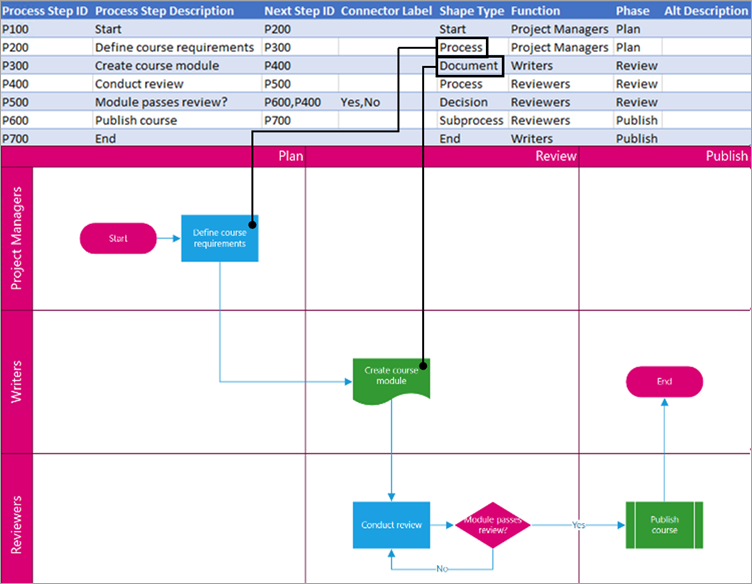
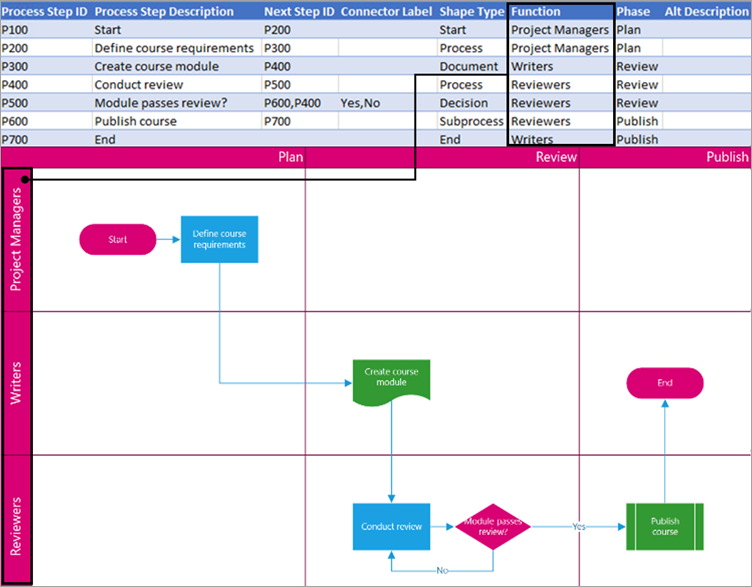
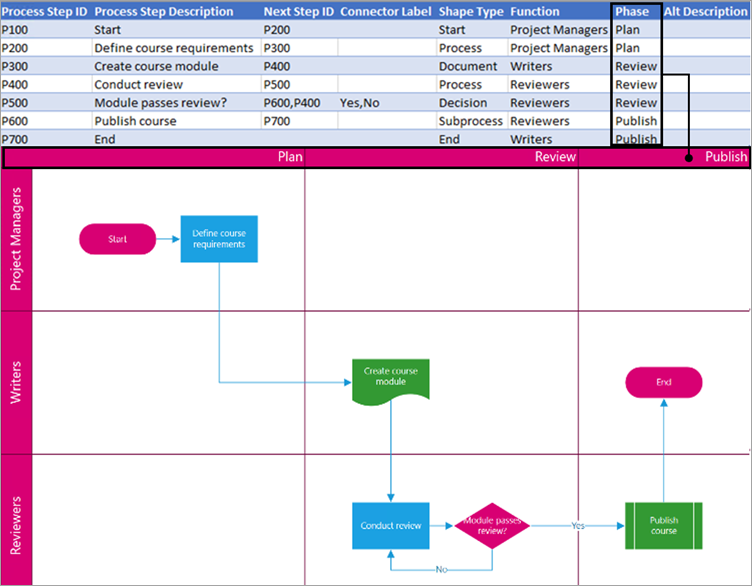
Each column of the table uniquely identifies an important aspect of the flowchart that you see. See the reference information below to learn more about each column and how it applies and affects the flowchart.

A number or name that identifies each shape in the diagram. This column is required, and each value in the Excel table must be unique and not be blank. This value does not appear on the flowchart.

The Process step ID uniquely identifies each shape.

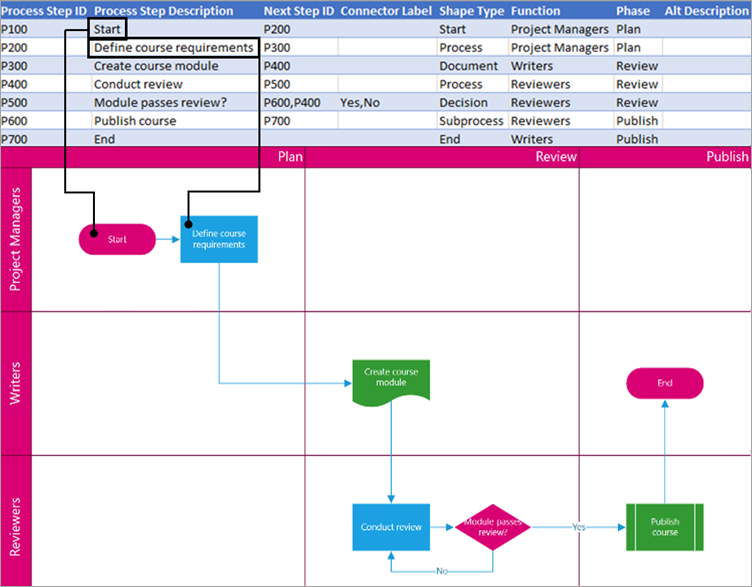
This is the shape text that is visible in the diagram. Describe what occurs in this step of the process. Consider also adding a similar or more descriptive text to the Alt text column.

Description for the process step that displays in the shape.

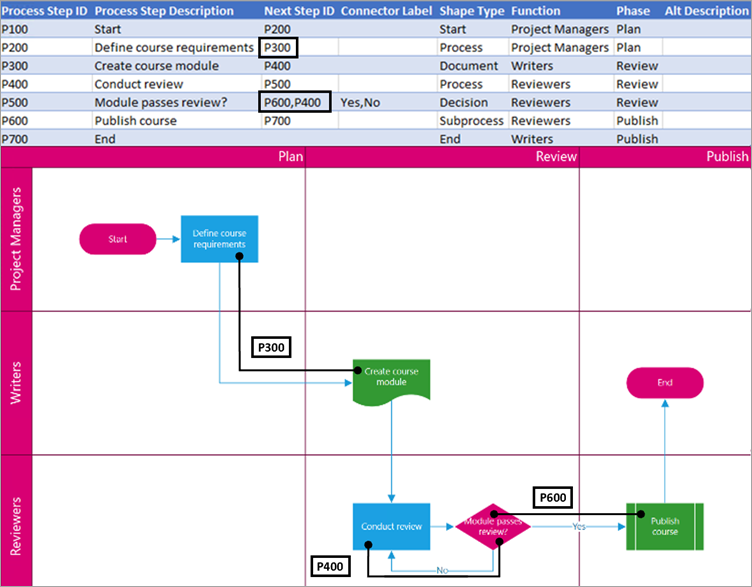
The Process Step ID of the next shape in the sequence. A branching shape has two next steps and is represented by comma-separated numbers such as P600,P400. You can have more than two next steps.

The next Process step ID in the logic of the diagram.

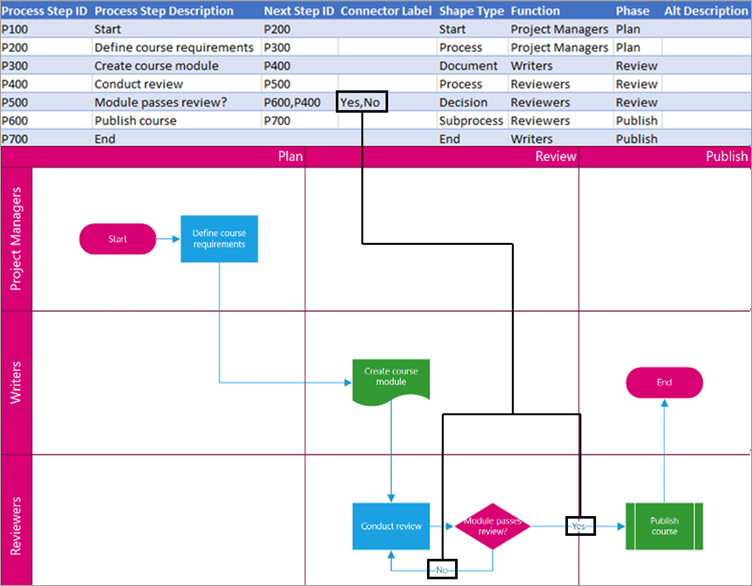
For branching shapes, connector labels are represented as text separated by a comma, such as Yes,No. Yes corresponds to P600 and No corresponds to P400 in the example. Connector labels are not required.

A name for a specific connector label.

The type of shape you want to represent in the Visio diagram, such as Process or Decision. Select a cell in the column and choose from the list of Shape Types.

For more information on flow charts and their shapes, see Create a basic flowchart and Create a cross-functional flowchart.

Determines the type of shape.

The function (or swimlane) that each shape belongs to. Use the Function and Phase columns to help you organize different stakeholders in your flowchart. This column only applies to a Cross-Functional Flowchart and isn't included as part of the Basic Flowchart diagram.

The function or swimlane in which a step occurs.

The phase (or timeline) that each shape belongs to. Use the Function and Phase columns to help you organize different stakeholders in your flowchart. This column only applies to a Cross-Functional Flowchart and isn't included as part of the Basic Flowchart diagram.

The phase or timeline in which a step occurs.

Alt text is used by screen readers to assist those with visual impairments. You can view alt text you've entered as part of the Shape Info of a shape. Entering descriptive alt text is not required, but recommended.

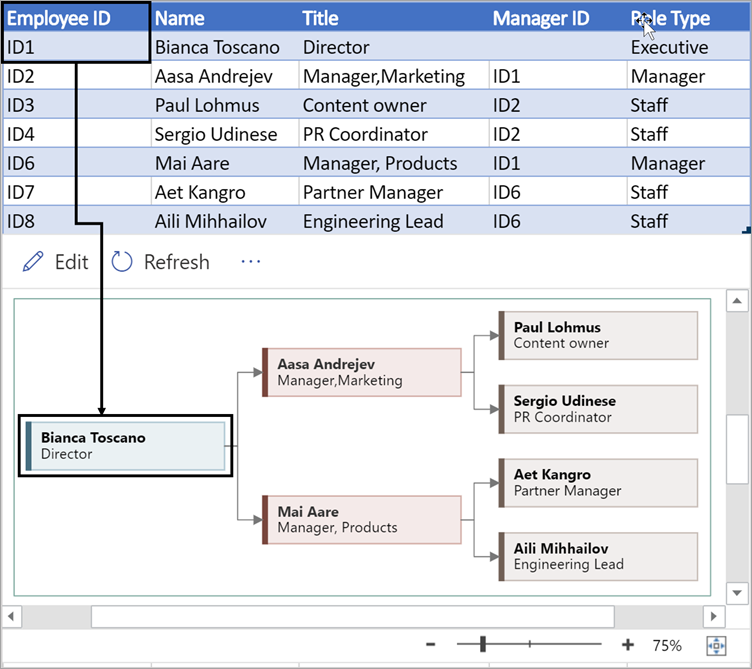
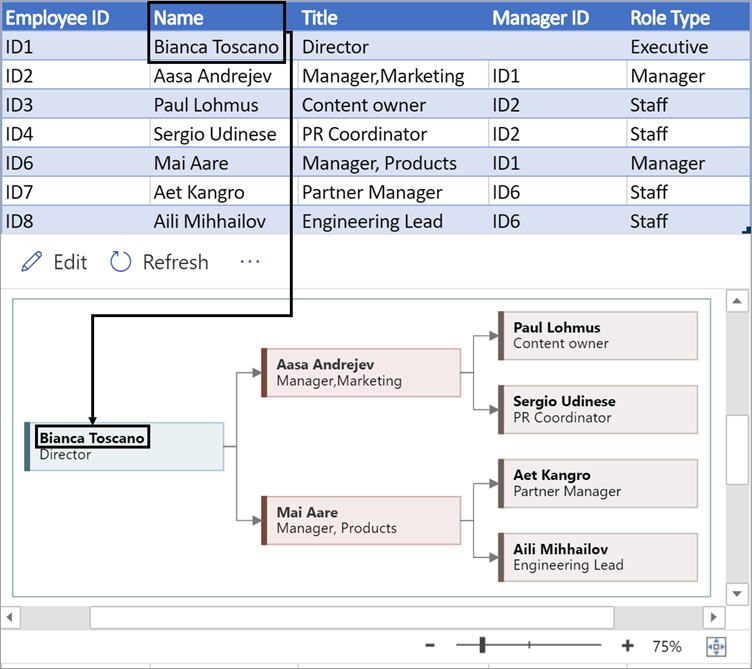
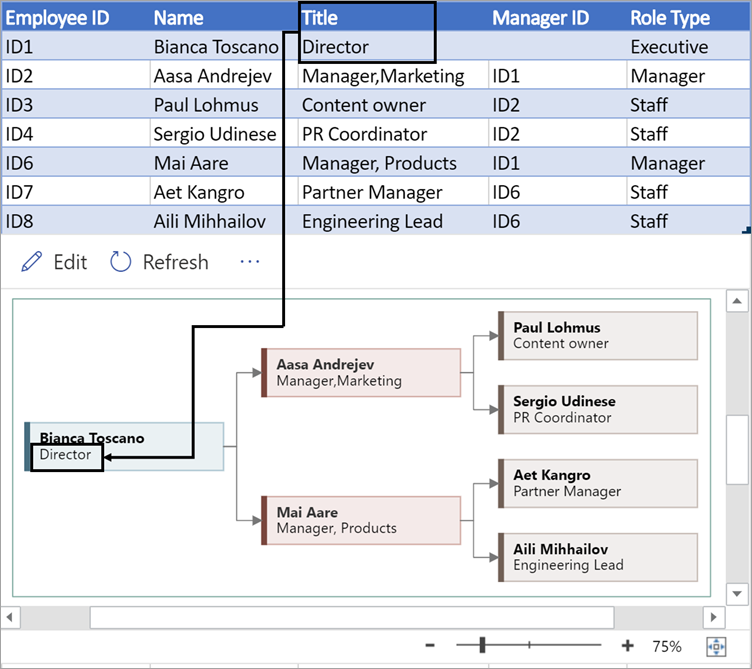
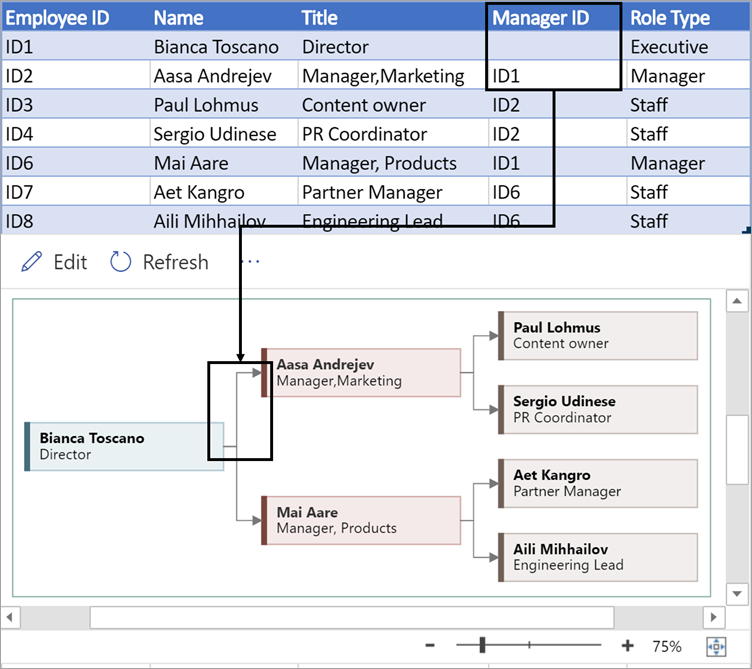
Each column of the table uniquely identifies an important aspect of the organization chart that you see. See the reference information below to learn more about each column and how it applies and affects the diagram.

A number that identifies each employee in your organization chart. This column is required, and each value in the Excel table must be unique and not blank. This value doesn't appear in the diagram.

Enter a unique number that identifies each employee in your organization chart.

Enter the full name of the employee you want to associate with the employee ID number. This text displays in the diagram as shape text.

Enter the full name of the employee you want to associate with the employee ID number.

Provide additional details for the employee by entering the job title or role. This text displays in the diagram shapes underneath the employee's name.

Enter the job title or role for the employee.

To create the structure of the organization chart, use this column to identify the manager of each employee. You can leave it blank for those who don't report to anyone. You'll enter the corresponding employee ID from the first column. You can also separate multiple managers using a comma.

Enter the employee ID of the manager of the employee.

Organization charts in the add-in come with different role types for you to choose from. Select a field under the Role Type column to choose a role that best describes the employee. This will change the color of the shape in the diagram.

Choose the role types that best describes the employee.

Supported languages for the Data Visualizer add-in

Click the subheading to open the list:

  • Chinese (Simplified)

  • Chinese (Traditional)

  • Czech 

  • Danish

  • Dutch 

  • German

  • Greek

  • English

  • Finnish

  • French

  • Hungarian

  • Italian

  • Japanese

  • Norwegian 

  • Polish

  • Portuguese (Brazil)

  • Portuguese (Portugal)

  • Romanian 

  • Russian

  • Slovenian 

  • Spanish

  • Swedish

  • Turkish

  • Ukrainian 

See Also

About the Data Visualizer add-in for Excel

Automatically open a specific workbook or template when you start excel

If you're always using Excel to work on the same workbook or create new workbooks based on the same template. You can set Excel to open that workbook or template when it starts.

To open the same workbook every time you start Excel, in the File menu click > Save as > Computer, Browse and then browse to the XLSTART folder.

  • In a clean install of Windows Vista and later, the path to the XLSTART folder is usually:

    Office 2013 – C:\Users\(User name)\AppData\Microsoft\Excel\XLSTART


Office 2013 C2R – C:\Users\(User name)\AppData\Microsoft\Excel\XLSTART

  • If you upgraded from another version of Windows, the path could also be:

    Office 2013 – C:\Program Files\Microsoft Office\Office 15\XLSTART

    Office 2013 C2R – C:\Program Files\Microsoft Office 15\root\Office 15\XLSTART

Note:  If your workbook or template contains a macro that automatically runs when the workbook is opened, such as Auto_Open. By default that macro will also run when you start Excel.

Use an alternate startup folder

If you want to save your startup workbook to a different location, do the following:

  1. Click File > Excel Options > Advanced.

  2. Under General, in the At Startup, open all files in box, type the full path of the folder that you want to use as the alternate startup folder.

Note:  Because Excel will try and open every file in the alternate startup folder, make sure that you specify a folder that contains only files that Excel can open. If a workbook with the same name is in both the XLSTART folder and the alternate startup folder, the file in the XLSTART folder will open.

Stop a specific workbook from opening when you start Excel

To stop a workbook from opening automatically when you start Excel do the following:

  • Navigate to the folder where the workbook was saved (either the XLSTART folder or an alternate folder location), select the workbook and press Delete.

Automatically open a workbook template when you start Excel

You can save workbook settings that you frequently use in a workbook template, and then automatically open that workbook template every time you start Excel.

To use a workbook template, create a workbook that contains the sheets, default text (such as page headers and column/row headers), formulas, macros, styles and other formatting that you want to use every time you use the template.

Settings that can be saved in a template:

  • Cell and sheet formats.

  • Page formats and print area settings for each sheet.

  • Cell styles.

  • The number and type of sheets in the workbook.

  • Protected and hidden areas of the workbook. You can hide sheets, columns and rows to prevent changes to workbook cells.

  • Text you want to repeat, such as page, column and row labels.

  • Data, graphics, formulas, charts and other information.

  • Data validation settings.

  • Macros, hyperlinks and ActiveX controls on forms.

  • Workbook calculation options and window view options.

To create a template, do the following:

  1. Click File > Save As.

  2. In the Save as type box, click Template.

  3. In the Save in box, select the folder where you want to store the template.

  4. In the File name box, do one of the following:

    • To create the default workbook template, type Book.

    • To create the default worksheet template, type Sheet.

    • To create a custom workbook or worksheet template, type the name you want to use.

  5. Click Save.

  6. Click File > Close.

Prevent automatic macros from running when you start Excel

Automatic macros (such as Auto_Open) that have been recorded in a workbook that open when you start Excel will run as soon as the workbook opens.

  • To prevent macros from running, hold down the Shift key when you start Excel.

Learn about performancepoint scorecards

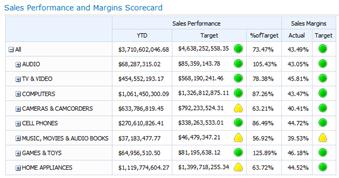
Scorecards are used to show performance for one or more items, such as key performance indicators (KPIs) by comparing actual results to target values. Scorecards resemble tables that include graphical indicators. PerformancePoint scorecards are scorecards that are created by using PerformancePoint Dashboard Designer.

Dashboard users can explore data, apply filters, and export copies of PerformancePoint scorecards to Microsoft PowerPoint or Microsoft Excel. Simple scorecards are typically used to compare actual results to target values. However, PerformancePoint scorecards vary in complexity and can include advanced functionality.

A PerformancePoint scorecard might resemble the following image:

Scorecard that was created by using PerformancePoint Dashboard Designer

The following list describes some of the features you might see in a PerformancePoint scorecard:

  • Trend indicators, such as arrows, that show whether performance has improved, remained the same, or decreased from a previous time period.

  • Complex KPIs that measure performance by comparing multiple values or using calculated metrics. For example, suppose that sales performance is determined not just by comparing gross sales amounts to quota, but also by factoring in gross profit margin and weighted sales metrics. You can have KPIs that show all the measures of sales performance and then calculate an overall performance measurement.

  • Time Intelligence to show performance for dynamic time periods or as of a particular date. For example, you might have a column labeled Last Six Months in your scorecard that is automatically updated.

  • Expandable and collapsible rows or columns that you can use to see lower or higher levels of detail in the scorecard. For example, suppose that you have an item called All Products on rows in your scorecard. Depending on how the scorecard is configured, you can click Products and see the next level of detail. The scorecard updates and displays additional rows, one for each item in the Products group.

  • KPIs that are used as filters for other reports, such as analytic charts or grids in a dashboard. For example, suppose that you have a scorecard that is connected to an analytic chart. When you click a KPI, the analytic chart automatically updates to display information that is relevant to that KPI. When you click another KPI, the report updates again to display information for that KPI, and so on.

  • The ability to open a Decomposition Tree to analyze how individual members contribute to a value. Depending on how the scorecard is configured and if it uses SQL Server Analysis Services data, you can right-click value and then click Decomposition Tree.

PerformancePoint scorecards can use data that is stored in any of the following data sources:

  • SQL Server Analysis Services

  • A SharePoint List

  • An Excel Services file

  • A table in SQL Server

  • A list of values that is created by the scorecard author

Import an outlook task list into project

If you keep a list of tasks in Outlook, you can easily import all or some of its tasks into Microsoft Office Project.

  1. In Project, on the Task tab, in the Insert group, choose Task > Import Outlook Tasks

  2. In the Import Outlook Tasks dialog box, select the tasks that you want to import.

  3. Choose OK to import the tasks into the current project.

  4. In Project, schedule the tasks as needed.

    Notes: 

    • Tasks are appended to any existing tasks in the current project. If the project does not contain tasks, a new task list is created.

    • Only the task name, notes, and duration are imported. Task dates are not imported.

    • When you import tasks from Outlook, no connection is maintained between Outlook and Project. The tasks are simply copied to your project.

Create or schedule an appointment

Appointments are activities that you schedule in your calendar that do not involve inviting other people or reserving resources. You can turn an appointment into a meeting by adding attendees. 

Create an appointment

  1. From your Calendar folder, select New Appointment or click Ctrl+N. From any other folder, click Ctrl+Shift+A. 

  2. Enter a subject, location, start time, and end time. 

  3. Select Save & Close to save your appointment.

Note: By default, Outlook starts and ends appointments on the hour or the half hour. If you'd like to enter a custom time, for example 12:22 p.m., click in the start or end time fields and type in the exact time you need.

Outlook for Windows and Outlook for iOS - Better Together

Use Outlook Mobile together with Outlook for PC for additional features. If you use Outlook for iOS, your mobile device can remind you when you need to leave to make it to your appointments on time.

Turn on Time To Leave

  1. From Outlook for iOS, select Settings > Time To Leave.

  2. Select a supported account, then use the slider to enable Time To Leave.

Note: Time To Leave is not yet available for Outlook for Android. Only Office 365, Outlook.com, and some Gmail accounts are supported.

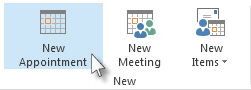
  1. Select New Appointment. Alternately, you can right-click a time block in your calendar grid and click New Appointment, double-click any blank area of the Calendar, or use the keyboard shortcut Ctrl+Shift+A.

    New appointment command on the ribbon

  2. In the Subject box, enter a description.

  3. In the Location box, enter the location.

  4. Enter the start and end times.

    Tip: You can type specific words and phrases in the Start time and End time boxes instead of dates. For example, you can type Today, Tomorrow, New Year's Day, Two Weeks from Tomorrow, Three days before New Year's Day, and most holiday names.

  5. To show others your availability during this time, in the Options group, select the Show As box and then select Free, Working Elsewhere, Tentative, Busy or Out of Office from the drop-down.

  6. To make the appointment recurring, in the Options group, select Recurrence Button image. Select the frequency (Daily, Weekly, Monthly, Yearly) that the appointment recurs, and then select options for the frequency. Click OK.

    Note: Adding a recurrence to an appointment changes the Appointment tab to say Appointment Series.

  7. By default, a reminder appears 15 minutes before the appointment start time. To change when the reminder appears, in the Options group, select the Reminder box arrow and then select the new reminder time. To turn the reminder off, select None.

  8. Select Save & Close.

Tip: If you want to change an appointment to a meeting, select Invite Attendees from the Attendees group in the ribbon.

Create an appointment or meeting from an email message

There are two ways to create an appointment or a meeting from an email message.

  • Right-click an email in your inbox, then select Quick Steps > New Meeting. An appointment will open with the email message as an attachment, and you can add attendees to turn the appointment into a meeting.

  • Click to select the email message in your message list, then choose Reply with Meeting from the Ribbon. This creates a new meeting request with the message sender on the To line and the email message included in the body of the meeting request.

Related Tasks

Schedule a meeting with other people

Find a conference room

Create a meeting or appointment from an email message

Tuesday, February 1, 2022

Sort records on text numeric or date values

Sorting data can play a big role in making a report or form effective and easy to use. For example, a product catalog that lists the products in alphabetical order or on the basis of unit price is much easier to use than one that lists the items in random order.

This topic explains how to sort records when viewing and designing a table, query, form, or report.

In this article

Introduction

You can sort the records in a table, query, form, or a report on one or more fields. With minimal design work, you and the users of your form or report can choose how the records are sorted.

For example, when you design the product catalog report, you might choose to list the products in alphabetical order. The order you choose when you design an object becomes the object's default sort order. But when viewing the query or report, each of your users can sort the records the way they want, such as by price or by supplier.

Note: A view can be sorted on any field that is displayed in the view, except on fields that contain attachments or OLE objects.

You can fine-tune your results by sorting records on more than one field. When sorting on multiple fields, it is important to identify what are known as the outermost and innermost sort fields. Designating the appropriate fields as inner and outer sort fields is necessary to get the results you want. As an example, suppose you want to sort the Contacts table on the FirstName and LastName fields. If you want the first names sorted from A to Z (or Z to A) within each last name, FirstName is the innermost field. On the other hand, if you want the last names sorted within each first name, LastName is the innermost field. Put another way, the records are sorted first (outermost) on the LastName field and then next (innermost) on the FirstName field.
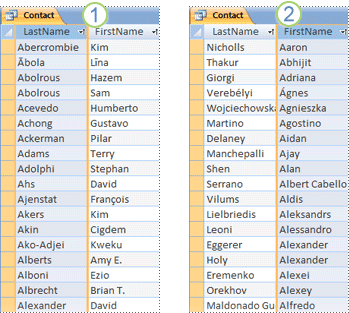
Innermost and outermost sort fields

1. LastName is the outermost field and FirstName is the innermost field

2. FirstName is the outermost field and LastName is the innermost field

One thing to remember when applying sort orders is that numbers, text, and special characters are sorted according to the selected language and regional settings of your computer. If the language and regional settings specified in the Access Options dialog box do not match those specified in Control Panel, the resulting sort orders might not match your expectations.

Review or change the default language or region

To review the language settings in Access, click File > Options. On the General tab under Creating databases, review or change the value in the New database sort order list box. Set the option to General if you want to use one of these languages — Afrikaans, Albanian, Arabic, Basque (Basque), Bulgarian, Belarusian, Catalan, Dutch, English, Faeroese, Farsi, German-Standard, Greek, Hebrew, Hindi, Indonesian, Italian, Malay, Portuguese, Russian, Serbian, Swahili, and Urdu. Note that this setting affects only new databases. To apply this setting to an existing database, first compact the database.

To compact the database:

  • Click Database Tools > Compact and Repair Database.

To review the regional settings for your computer, see Change the Windows regional settings to modify the appearance of some data types.

Top of Page

Sort the records in a view

Note: In Access, sorting a report is slightly different from sorting a table, query, or form.

Sort a report

Sort a table, query, or form

Sort a report

  1. Open a report in Layout view or Design view.

  2. If the Group, Sort, and Total pane is not open, in the Grouping & Totals group (on the Format tab in Layout view, or on the Design tab in Design view), click Group & Sort.

  3. Do one of the following:

    • If the report is neither grouped nor sorted, click Add a group in the Group, Sort, and Total pane, and then select the outermost sort field. Click the second drop-down arrow and choose how the values should be ordered. Click More, then click the arrow to the right of with a header section, and select without a header section. Repeat these steps for each sort field, with the innermost sort field appearing at the bottom.

    • If the report is already grouped or sorted, review the existing levels and make changes carefully. To change a field, use the first drop-down arrow. To change the order, click the second drop-down arrow. To change a grouping level to just a sorting level, change with a header section to without a header section.

Tip: To sort a report on a single field, open the report in Layout view, right-click the field, and select the sort command you want. For example, if you select the Age field, click either Sort Smallest to Largest or Sort Largest to Smallest. But if the report is grouped or if you want to sort on multiple fields, you must use the Group, Sort, and Total pane.

Sort a table, query, or form

  1. Identify the fields on which you want to sort. To sort on two or more fields, identify the fields that will act as the innermost and outermost sort fields.

  2. Right-click anywhere in the column or control corresponding to the innermost field, and click one of the sort commands. The commands vary with the type of data that is in the selected field.

    Note: When sorting data for a field that is of the Yes/No data type, a value of "Yes", "True" or "On" is considered "Selected", and a value of "No", "False" or "Off" is considered "Cleared". The default display for this type of field is a check box, but you can set it to display as a text box or a combo box. If you change the display for this type of field to text box or combo box, it still sorts as "Selected" or "Cleared".
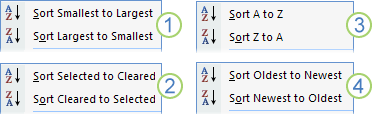
    Sort Options

    1. Number, Currency, AutoNumber

    2. Short Text (text), Long Text (Memo), Hyperlink

    3. Yes/No

    4. Date/Time

  3. Repeat the previous step for each sort field, ending with the outermost sort field.

    The records are rearranged to match the sort order.

    Note: If a text field contains null and zero-length strings, when sorted in ascending order, the records with null values are listed first, then the records with zero-length strings, and then the records with nonblank values.

    Learn about how special characters, leading spaces, and negative values are handled during sorting

    If a value in a field starts with a special character — such as a hyphen, parenthesis, or other symbol — you will observe the following behavior when sorting in ascending order:

    • Values that start with a space character will appear before alphanumeric values.

    • Values enclosed in quotation marks follow values that start with a space, but precede alphanumeric values.

    • Values that start with the minus sign (-) precede values that start with the plus (+) sign.

    • For all other symbols, the order is determined by looking at the ASCII character codes of the characters. For example, the code for the dollar symbol ($) is 36, and the code for the equal sign (=) is 61, so values starting with $ will appear before values that start with =.

      To override this order, you can choose to ignore the first character of all the values in the field. This technique works if the values in the field always start with a single special character, such as a minus sign, or with the same number of special characters — this way, you know how many characters to ignore. For step-by-step information about how to sort on partial values, see the article Sort records based on partial values in a field. If the number of characters to ignore varies, you can specify a custom sort order. For step-by-step information, see the article Sort records in custom order.

Remember that you cannot remove a sort order from just a single field. To remove sorting from all sort fields, on the Home tab, in the Sort & Filter group, click Clear All Sorts, and then apply the sort orders you want.

Additional sorting scenarios    

When you use the sort commands, the data type of the field and the complete values of each field are used to determine the order of records. But what if you want text values, such as Monday, Tuesday, and so on, sorted in custom order and not in alphabetical order? Or, you want to sort a text field that contains IP addresses? See the following topics if your sorting needs are not met by the sort commands:

  • Sort records based on partial values in a field Want to sort records based on the first few or last few characters in a field? If you are comfortable writing simple expressions, see this topic that explains how to use expressions to extract partial values.

  • Sort records in case-sensitive order Access ignores the case of text values. For example, the values smith and Smith will be treated as exactly the same, and you cannot control which one will appear first. See this topic if you want to do case-sensitive sorting.

  • Sort records on numeric values stored in a text field Do you see records sorted on the individual digits and not on the numeric value? If, for example, records with values 11 and 121 appear before records with values 2 or 25, see this article.

  • Sort records in custom order If you want to sort certain values, such as names of days (Monday, Tuesday, and so on) or employee titles (Manager, Director) in an order that is meaningful to you, see this article.

  • Sort IP addresses A field that stores IP addresses contains multiple numbers and periods (.), and so a simple text or numeric sort will not work for IP addresses. See this topic to learn how to sort IP addresses.

Top of Page

Remove a sort order

  • To remove a sort order from a table, query, or form, on the Home tab, in the Sort & Filter group, click Clear All Sorts.

    This will remove the sort order from all fields in the view.

  • To remove a sort order from a report, open the Group, Sort, and Total pane by clicking Group & Sort in the Grouping & Totals group (on the Format tab in Layout view, on the Design tab in Design view). Then, click the sorting level that you want to remove, and click Delete. An entry corresponding to a sort field will start with the words Sort by. Avoid deleting entries that start with Group by, because that will change the design of the report.

Top of Page

Save a sort order with an object

The last-applied sort order is automatically saved with the table, query, form, or report. If you want it automatically applied the next time you open the object, make sure the OrderByOnLoad property of the object is set to Yes.

Since the last-applied sort order will change from time to time, you might want to define a permanent (or default) sort order. You can specify a default sort order for a query or report. An important thing to note is that although the default sort order is not overwritten by the current or last-saved sort order, it comes into effect only when the current or last-saved sort order is removed from the view.

  • To define a default sort order for a query, open it in Design view. Add the sort fields to the design grid and, in the Sort row, specify the order you want.

  • To define a default sort order for report, use the Group, Sort, and Total pane in Layout or Design view. For step-by-step information, see the section Sort a report.

To see the records sorted in default sort order, on the Home tab, in the Sort & Filter group, click Clear All Sorts. This removes the current or last-saved filter from the view, and lets you view the records in default order.

Top of Page