Sunday, August 1, 2021

Manage a new hr policy rollout

Rolling out a new HR policy requires collaborating with multiple team members, finalizing changes, deciding who should receive it, and assessing success metrics, which can be complicated. You need an easy way to bring everyone together to give the input needed to make the rollout a success.

Your browser does not support video.

Details  

Set up a channel in Microsoft Teams to bring the people and resources you need all in one place. Store documents in the Files tab in Teams so team members can work together and coauthor policy changes in real time. Then add Project Online to a tab in Microsoft Teams to track the progress. Use chat and @mentions to follow up on tasks.

You can also use Project Online to measure and report on metrics. Knowing how your resources are being used can help you ensure you're hitting the project on time and on budget. With many customizable reports from Excel Online, you can easily see how your resources are allocated across the team.

Highlights

  • Use project management tools across devices.

  • Easily coordinate, assign, and track tasks.

  • Measure and report on success metrics.

Learn More

Microsoft Project: Execute projects with ease

Activate features for sites

With the proper permissions – Full Control, Design, or Edit – you can activate or deactivate specific SharePoint features for your site. As an example, working with a Team site you can choose to activate a feature that creates a Microsoft OneNote notebook in the Shared Documents library of the site. Or perhaps you want to add community functionality such as discussion categories, content and people reputation and a members list.

To activate or deactivate features for a site

  1. Navigate to the site you want to configure.

  2. Click Settings  Settings button from SharePoint Online , click Site Settings. If you don't see Site settings, click Site information and then click View all site settings. Some pages might require you to select Site contents, and then Site settings.
  3. On the Site Settings page, under Site Actions, click Manage site features.

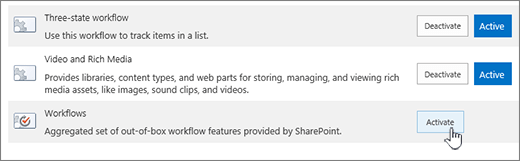
  4. Click Activate next to the feature you want to activate on the site, or click Deactivate if you want to turn off the feature on the site.

    Site collection feature enabling workflows

Manage text overflow in publisher

When a text box or AutoShape contains more text than it can display, Publisher stores the extra text in overflow. You can move your text out of overflow and back into your publication by moving text into another text box, fitting text automatically, enlarging the text box, changing the text size, changing the margins within the text box, or deleting some of the text in the text box.

Move text from the overflow into another text box

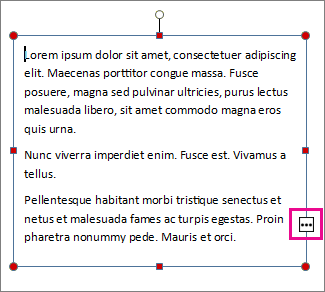
When a text box has too much text, a little box with ellipses appears in the lower right of the text box. You can link text boxes so that the overflow text flows from one box to another.

Screenshot of the text box overflow in Publisher.

  1. Create a new text box:

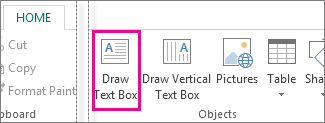
    • Click Home > Draw Text Box, and drag the cross shaped cursor to draw a box where you want text.

      Screenshot of the Draw text box in Publisher.

  2. Click the overflow indicator and your cursor becomes a pitcher. text box linking pitcher, used to link text boxes.

  3. Move to the new text box and click.

The overflow text will appear in the new text box.

Now as you add text, words flow from one text box to another. If you run out of room in the second box you can link to another text box, and the text will flow through all three boxes.

Fit text automatically

  1. Click anywhere in the text.

  2. On the Text Box Tools Format tab, click Text Fit, and do one of the following:

    • To reduce the point size of text until there is no text in overflow, click Shrink Text on Overflow.

    • To shrink or expand text to fit in the text box when you resize the box, click Best Fit.

Make the text box or AutoShape larger

  1. Click the object to select it.

  2. Position the mouse pointer over one of the handles until you see the Resize pointer move ruler .

  3. Do one of the following:

    • To resize the object proportionally, select a corner handle, and hold down Shift, and then proceed to step 4.

    • To stretch the object, select a top, bottom, or side handle, and then proceed to step 4.

  4. Hold down the mouse button and drag the handle to resize the object.

Change the text size

  1. Do one of the following:

    • To change the text size for a single word, place the insertion point within that word.

    • To change the text size for several words or a few characters, highlight the text to select it.

  2. On the Text Box Tools Format tab, enter a size in the Font Size box Button image .

Note: You can type font sizes that are different from those listed in the Font Size box, to a precision of 0.1 pt. For example, you can type a font size of 9.3 pt.

Change the margins within a text box or AutoShape

  1. Right-click the text box.

  2. On the menu, click Format text box. The Format Text Box dialog box appears.

  3. Click the Text Box tab.

  4. Under Text Box Margins, enter the settings for the left, right, top, and bottom margins.

Delete some of the text

  1. Select the text.

  2. Press Delete.

Move text from the overflow into another text box

  1. If needed, create a new text box:

    1. On the Objects toolbar, click Text Box Button image .

    2. In your publication, click where you want one corner of the text to appear, and then drag diagonally until you have the box size you want.

  2. Click in the text box with the overflow.

  3. On the Connect Text Boxes toolbar, click Create Text Box Link Button image .

    The mouse pointer changes to a pitcher text box linking pitcher, used to link text boxes. .

  4. Click in the text box you want as the next in the story.

    This text box is now connected to the first box and any text in the overflow now appears in the next box.

  5. To connect more text boxes to the story, repeat steps 3 and 4.

Fit text automatically

  1. Click anywhere in the text.

  2. On the Format menu, point to AutoFit Text, and do one of the following:

    • To reduce the point size of text until there is no text in overflow, click Shrink Text on Overflow.

    • To shrink or expand text to fit in the text box when you resize the box, click Best Fit.

Make the text box or AutoShape larger

  1. Click the object to select it.

  2. Position the mouse pointer over one of the handles until you see the Resize pointer move ruler .

  3. Do one of the following:

    • To resize the object proportionally, select a corner handle, and hold down SHIFT, and then proceed to step 4.

    • To stretch the object, select a top, bottom, or side handle, and then proceed to step 4.

  4. Hold down the mouse button and drag the handle to change the object.

Change the text size

  1. Do one of the following:

    • To change the text size for a single word, place the insertion point within that word.

    • To change the text size for several words or a few characters, highlight the text to select it.

  2. On the Formatting toolbar, enter a size in the Font Size box Button image .

Note: You can type font sizes that are different from those listed in the Font Size box, to a precision of 0.1 pt. For example, you can type a font size of 9.3 pt.

Change the margins within a text box or AutoShape

  1. Right-click the text box or AutoShape.

  2. On the shortcut menu, click Format <object type>.

  3. Click the Text Box tab.

  4. Under Text Box Margins, enter the settings for the left, right, top, and bottom margins.

Delete some of the text

  1. Select the text.

  2. Press Delete.

Join a meeting

You can connect to a conference call or the audio portion of an online meeting by calling in.

What do you want to do?

Join a meeting or conference call by using Lync on the Android phone

You can join the audio portion of a Microsoft Lync 2010 communications software meeting from your mobile phone.

To join an online meeting, do the following:

  1. From your phone calendar, open the Online Meeting invitation for the meeting that you want to join.

  2. Tap the Join online meeting link. Lync calls you on your mobile phone.

  3. Accept the Lync call to join the meeting.

Join a meeting or conference call by phone

You can also dial in to the meeting from any phone by dialing the Join by Phone numbers listed in the meeting invitation.

Waiting in the meeting lobby

The meeting lobby is an online waiting area. The meeting leader can control access to the meeting, or admit someone who doesn't have the correct meeting credentials. People in the lobby can be admitted singly, or all at once.

If the meeting leader has enabled the meeting lobby, you'll need to wait until the meeting leader admits you to the meeting.

Top of Page

Dax scenarios in power pivot

This section provides links to examples that demonstrate the use of DAX formulas in the following scenarios.

  • Performing complex calculations

  • Working with text and dates

  • Conditional values and testing for errors

  • Using time intelligence

  • Ranking and comparing values

In this article

Getting Started

Visit the DAX Resource Center Wiki where you can find all sorts of information about DAX including blogs, samples, whitepapers, and videos provided by industry leading professionals and Microsoft.

Scenarios: Performing Complex Calculations

DAX formulas can perform complex calculations that involve custom aggregations, filtering, and the use of conditional values. This section provides examples of how to get started with custom calculations.

Create custom calculations for a PivotTable

CALCULATE and CALCULATETABLE are powerful, flexible functions that useful for defining calculated fields. These functions let you change the context in which the calculation will be performed. You can also customize the type of aggregation or mathematical operation to perform. See the following topics for examples.

Apply a filter to a formula

In most places where a DAX function takes a table as an argument, you can usually pass in a filtered table instead, either by using the FILTER function instead of the table name, or by specifying a filter expression as one of the function arguments. The following topics provide examples of how to create filters and how filters affect the results of formulas. For more information, see Filter Data in DAX Formulas.

The FILTER function lets you specify filter criteria by using an expression, while the other functions are designed specifically to filter out blank values.

Remove filters selectively to create a dynamic ratio

By creating dynamic filters in formulas, you can easily answer questions such as the following:

  • What was the contribution of the current product's sales to total sales for the year?

  • How much has this division contributed to total profits for all operating years, compared to other divisions?

Formulas that you use in a PivotTable can be affected by the PivotTable context, but you can selectively change the context by adding or removing filters. The example in the ALL topic shows you how to do this. To find the ratio of sales for a specific reseller over the sales for all resellers, you create a measure that calculates the value for the current context divided by the value for the ALL context.

The ALLEXCEPT topic provides an example of how to selectively clear filters on a formula. Both examples walk you through how the results change depending on the design of the PivotTable.

For other examples of how to calculate ratios and percentages, see the following topics:

Using a value from an outer loop

In addition to using values from the current context in calculations, DAX can use a value from a previous loop in creating a set of related calculations. The following topic provides a walkthrough of how to build a formula that references a value from an outer loop. The EARLIER function supports up to two levels of nested loops.

To learn more about row context and related tables, and how to use this concept in formulas, see Context in DAX Formulas.

Scenarios: Working with Text and Dates

This section provides links to DAX reference topics that contain examples of common scenarios involving working with text, extracting and composing date and time values, or creating values based on a condition.

Create a key column by concatenation

Power Pivot does not allow composite keys; therefore, if you have composite keys in your data source you may need to combine them into a single key column. The following topic provides one example of how to create a calculated column based on a composite key.

Compose a date based on date parts extracted from a text date

Power Pivot uses a SQL Server date/time data type to work with dates; therefore, if your external data contains dates that are formatted differently -- for example, if your dates are written in a regional date format that is not recognized by the Power Pivot data engine, or if your data uses integer surrogate keys -- you may need to use a DAX formula to extract the date parts and then compose the parts into a valid date/time representation.

For example, if you have a column of dates that have been represented as an integer and then imported as a text string, you can convert the string to a date/time value by using the following formula:

=DATE(RIGHT([Value1],4),LEFT([Value1],2),MID([Value1],2))

Value1

Result

01032009

1/3/2009

12132008

12/13/2008

06252007

6/25/2007

The following topics provide more information about the functions used to extract and compose dates.

Define a custom date or number format

If your data contains dates or numbers that are not represented in one of the standard Windows text formats, you can define a custom format to ensure that the values are handled correctly. These formats are used when converting values to strings, or from strings. The following topics also provide a detailed list of the predefined formats that are available for working with dates and numbers.

Change data types using a formula

In Power Pivot, the data type of the output is determined by the source columns, and you cannot explicitly specify the data type of the result, because the optimal data type is determined by Power Pivot. However, you can use the implicit data type conversions performed by Power Pivot to manipulate the output data type. 

  • To convert a date or a number-string to a number, multiply by 1.0. For example, the following formula calculates the current date minus 3 days, and then outputs the corresponding integer value.

    =(TODAY()-3)*1.0

  • To convert a date, number, or currency value to a string, concatenate the value with an empty string. For example, the following formula returns today's date as a string.

    =""& TODAY()

The following functions also can be used to ensure that a particular data type is returned:

Convert real numbers to integers

Scenario: Conditional Values and Testing for Errors

Like Excel, DAX has functions that let you test values in the data and return a different value based on a condition. For example, you could create a calculated column that labels resellers either as Preferred or Value depending on the yearly sales amount. Functions that test values are also useful for checking the range or type of values, to prevent unexpected data errors from breaking calculations.

Create a value based on a condition

You can use nested IF conditions to test values and generate new values conditionally. The following topics contain some simple examples of conditional processing and conditional values:

Test for errors within a formula

Unlike Excel, you cannot have valid values in one row of a calculated column and invalid values in another row. That is, if there is an error in any part of a Power Pivot column, the entire column is flagged with an error, so that you must always correct formula errors that result in invalid values.

For example, if you create a formula that divides by zero, you might get the infinity result, or an error. Some formulas will also fail if the function encounters a blank value when it expects a numeric value. While you are developing your data model, it is best to allow the errors to appear so that you can click on the message and troubleshoot the problem. However, when you publish workbooks, you should incorporate error handling to prevent unexpected values from causing calculations to fail.

To avoid returning errors in a calculated column, you use a combination of logical and information functions to test for errors and always return valid values. The following topics provide some simple examples of how to do this in DAX:

Scenarios: Using Time Intelligence

The DAX time intelligence functions include functions to help you retrieve dates or date ranges from your data. You can then use those dates or date ranges to calculate values across similar periods. The time intelligence functions also include functions that work with standard date intervals, to allow you to compare values across months, years, or quarters. You could also create a formula that compares values for the first and last date of a specified period.

For a list of all time intelligence functions, see Time Intelligence Functions (DAX). For tips on how to use dates and times effectively in a Power Pivot analysis, see Dates in Power Pivot.

Calculate cumulative sales

The following topics contain examples of how to calculate closing and opening balances. The examples let you create running balances across different intervals such as days, months, quarters, or years.

Compare values over time

The following topics contain examples of how to compare sums across different time periods. The default time periods supported by DAX are months, quarters, and years.

Calculate a value over a custom date range

See the following topics for examples of how to retrieve custom date ranges, such as the first 15 days after the start of a sales promotion.

If you use time intelligence functions to retrieve a custom set of dates, you can use that set of dates as input to a function that performs calculations, to create custom aggregates across time periods. See the following topic for an example of how to do this:

  • PARALLELPERIOD Function

    Note: If you do not need to specify a custom date range, but are working with standard accounting units such as months, quarters or years, we recommend that you perform calculations by using the time intelligence functions designed for this purpose, such as TOTALQTD, TOTALMTD, TOTALQTD, etc.

Scenarios: Ranking and Comparing Values

To show only the top n number of items in a column or PivotTable, you have several options:

  • You can use the features in Excel 2010 to create a Top filter. You can also select a number of top or bottom values in a PivotTable. The first part of this section describes how to filter for the top 10 items in a PivotTable. For more information, see the Excel documentation.

  • You can create a formula that dynamically ranks values, and then filter by the ranking values, or use the ranking value as a Slicer. The second part of this section describes how to create this formula and then use that ranking in a Slicer.

There are advantages and disadvantages to each method.

  • The Excel Top filter is easy to use, but the filter is solely for display purposes. If the data underlying the PivotTable changes, you must manually refresh the PivotTable to see the changes. If you need to dynamically work with rankings, you can use DAX to create a formula that compares values to other values within a column.

  • The DAX formula is more powerful; moreover, by adding the ranking value to a Slicer, you can just click on the Slicer to change the number of top values that are displayed. However, the calculations are computationally expensive and this method might not be suited for tables with many rows.

Show only the top ten items in a PivotTable

To show the top or bottom values in a PivotTable

  1. In the PivotTable, click the down arrow in the Row Labels heading.

  2. Select Value Filters> Top 10.

  3. In the Top 10 Filter <column name> dialog box, choose the column to rank, and the number of values, as follows:

    1. Select Top to see the cells with the highest values or Bottom to see the cells with the lowest values.

    2. Type the number of top or bottom values that you want to see. The default is 10.

    3. Select how you want the values displayed:

Name

Description

Items

Select this option to filter the PivotTable to display only the list of the top or bottom items by their values.

Percent

Select this option to filter the PivotTable to display only the items that add up to the specified percentage.

Sum

Select this option to display the sum of the values for the top or bottom items.

  1. Select the column that contains the values you want to rank.

  2. Click OK.

Order items dynamically by using a formula

The following topic contains an example of how to use DAX to create a ranking that is stored in a calculated column. Because DAX formulas are calculated dynamically, you can always be sure that the ranking is correct even if the underlying data has changed. Also, because the formula is used in a calculated column, you can use the ranking in a Slicer and then select top 5, top 10, or even top 100 values.

Insert the current date and time on a page

Depending on how you use OneNote, you can insert your computer's current date and time anywhere in your notes. This is handy when you want to mark text or track chronological events, such as a log of phone calls or entries in a blog or journal.

Note: Inserting the current date and time in your notes is different from the page creation date and time that OneNote places underneath the page title whenever you add a new page to your notebook. You can change or remove the page creation date or time if you'd like.

  1. In your notes, place the cursor where you want to insert the current date and time.

  2. Do one of the following:

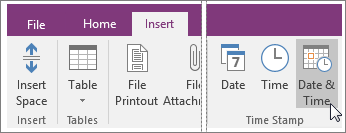
    • Click Insert, and then click either Date, Time, or Date & Time.

      Screenshot of the Date and Time button in OneNote 2016.

    • To insert the current date and time, press Alt+Shift+F.

    • To insert only the date, press Alt+Shift+D.

    • To insert only the time, press Alt+Shift+T.

OneNote uses the date and time format specified in the Windows Control Panel. If you want to change the appearance of dates and times in OneNote, follow the steps below for your version of Windows.

  • Windows 10
    Close OneNote and open the Control Panel in Windows 10 (From the Search bar in the lower-left corner of the screen, type control panel). Click Clock, Language, and Region, and then click Region. In the Region dialog box, on the Formats tab, choose the time and date formats you want, and then click OK. Any changes you've made will be applied to future date and time stamps that you insert; existing notes won't be automatically reformatted with the new settings.

  • Windows 8
    Close OneNote and open the Control Panel in Windows 8 (Swipe in from the right—if you're using a mouse, point to the upper-right corner—and choose the Search icon. Type control panel). Click Clock, Language, and Region, and then click Region. In the Region dialog box, on the Formats tab, choose the time and date formats you want, and then click OK. Any changes you've made will be applied to future date and time stamps that you insert; existing notes won't be automatically reformatted with the new settings.

  • Windows 7
    Close OneNote and open the Control Panel in Windows 7. Click Clock, Language, and Region, and then click Region and Language. In the Region and Language dialog box, on the Formats tab, choose the time and date formats you want, and then click OK. Any changes you've made will be applied to future date and time stamps that you insert; existing notes won't be automatically reformatted with the new settings.

Customize the save experience in office

If you're looking to customize your experience when saving a new file via CTRL+S or pressing the Save button in the Quick Access Toolbar, here are some options to meet your needs. 

Usually use the cloud, but sometimes need to save locally?

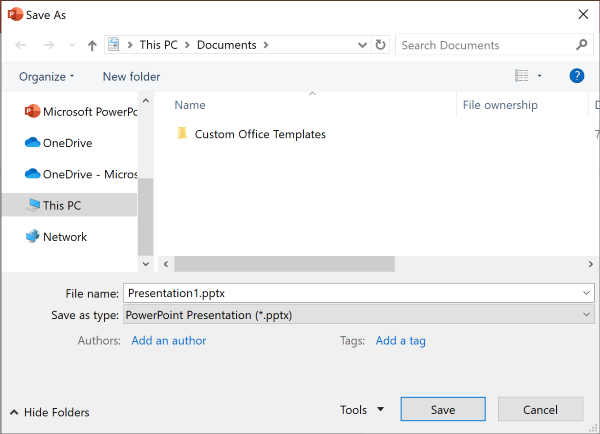
When you want to save locally use Save As instead, which, as before, triggers the legacy save dialog. You can easily add Save As to the Quick Access Toolbar (QAT) or use the F12 keyboard shortcut.

The legacy Save As experience in PowerPoint

Don't use the cloud, but usually save to one location?

If you don't save your files to the cloud, and want to save to a default location on your local device, continue using the new dialog with a default local location.

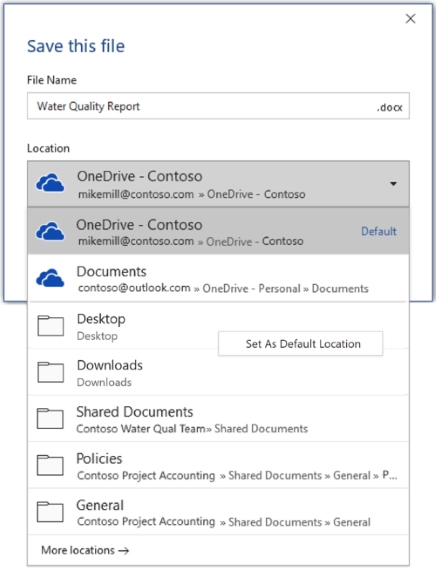
From the location dropdown, you can set any recent location as your default location by right-clicking on that location or by pressing the application key on any of the locations shown. A screenshot of how to set the default location in Word while saving a new file

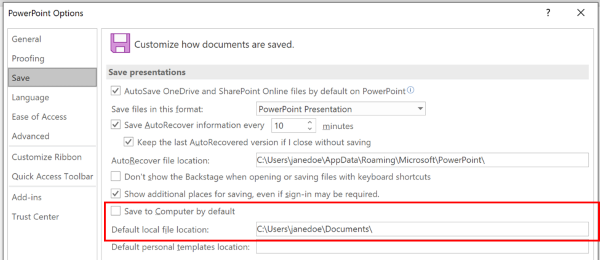
Or, via File > Options > Save, you can check "Save to Computer by default" and set "Default local file location" to the desired location.  A screenshot of the PowerPoint Options dialog highlighting the section to customize the default location

Prefer a more classic folder browsing experience, like in Windows Explorer?

Use the classic Save dialog instead.

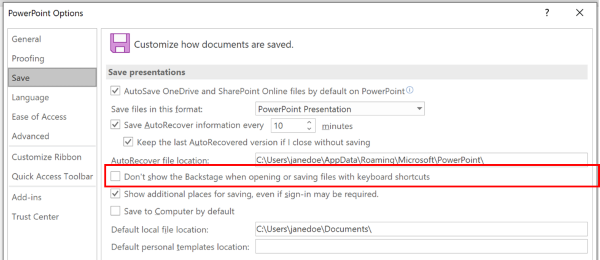
Via File > Options > Save, check "Don't show the Backstage when opening or saving files with keyboard shortcuts".

A screenshot of the PowerPoint Options dialog highlighting the setting to not use the Backstage when saving with keyboard shortcuts

Want to use the Backstage to immediately browse all your folders or access different connected sites? 

Go to the Backstage by clicking on File > Save.

Set a default working folder

The Documents folder is the default working folder for all of the files that you create in your Microsoft Office programs. You can choose a different default working folder.

Location of the default Documents folder

The folder that you select applies only to the program that you are currently using. For example, if you change the default working folder for Word, the default working folder for PowerPoint is still Documents.

Excel, PowerPoint, Project, and Word

  1. Click the File tab, and then click Options.

  2. Click Save.

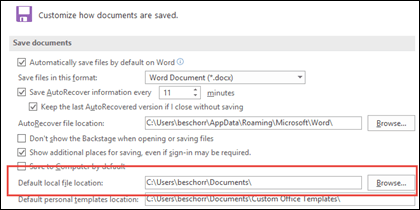
  3. In the first section, type the path in the Default local file location box or

    The Save options in Word, showing the default working folder setting

Note: In Word you can also click Browse to navigate to the folder you want to use.

Select a heading below for more information about that application  

  1. Click the File tab, and then click Options.

  2. Click General.

  3. Under Creating databases, in the Default database folder box, click Browse and navigate to the default database folder you want, or type the path of the folder where you want to store Access database files.

  1. Click the File tab, and then click Options.

  2. Click General, and then, under InfoPath Options, click More Options.

  3. Click the Design tab.

  4. At the Project location for Visual Basic and C# code: field, Browse to the new default folder and click Open.

  5. Click OK to save your changes.

When you set a default working folder in Visio, the folder that you designate for a particular type of file is the first place that Visio searches for any file of that type. If Visio fails to find a specific file in the designated folder, it searches in the My Documents folder for drawings and templates and in the My Documents\My Shapes folder for stencils. It searches in the Documents and Settings\user name folder for add-ins.

  1. Click the File tab, and then click Options.

  2. Click Advanced, and then, under General, click File Locations…

  3. For each file type that you want to set a default folder for, click the appropriate Browse  Button image  button, and then browse to the folder where you want to store that file type. You can have separate storage folders for each of the following types of files:

    • My Shapes

    • Drawings

    • Templates

    • Stencils

    • Help

    • Add-ons

    • Start-up

  4. Click OK twice.

Note: You can add more than one folder for each file type. If you do so, the first folder is the default working folder. If the first folder is not available (for example, a network share that may be temporarily unavailable), Visio uses the next folder in the list. Property report definitions that are saved to these locations are available in the Reports dialog box. Find links to more information about property reports in the See Also section.