Friday, February 1, 2019

Insert a table

Insert a table

Your browser does not support video. Install Microsoft Silverlight, Adobe Flash Player, or Internet Explorer 9.

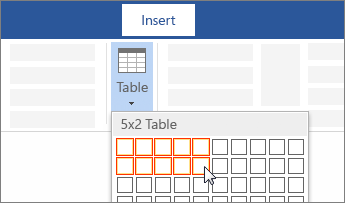
For a basic table, click Insert > Table and move the cursor over the grid until you highlight the number of columns and rows you want.

Insert a table by dragging to select the number of cells

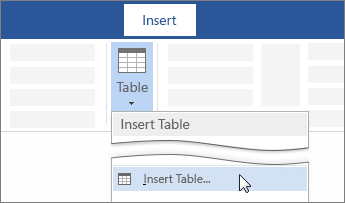
For a larger table, or to customize a table, select Insert > Table > Insert Table.

Insert Table option on the Word ribbon

Tips: 

  • If you already have text separated by tabs, you can quickly convert it to a table: Select Insert > Table, and then select Convert Text to Table.

  • You can even draw a table: Select Insert > Table > Draw Table.

KURT function

KURT function

Returns the kurtosis of a data set. Kurtosis characterizes the relative peakedness or flatness of a distribution compared with the normal distribution. Positive kurtosis indicates a relatively peaked distribution. Negative kurtosis indicates a relatively flat distribution.

Syntax

KURT(number1,number2,...)

Number1,number2,...     are 1 to 30 arguments for which you want to calculate kurtosis.

Remarks

  • The arguments must be either numbers or column references that contain numbers.

  • If a column reference argument contains text, logical values, or is empty, those values are ignored; however, arguments with the value zero are included.

  • If there are fewer than four data points, or if the standard deviation of the sample equals zero, KURT returns the #DIV/0! error value.

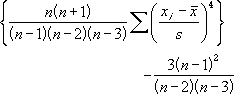
  • Kurtosis is defined as:

    Equation

    where:

    s is the sample standard deviation.

Example

Col1

Col2

Col3

Col4

Col5

Col6

Col7

Col8

Col9

Col10

Formula

Description (Result)

3

4

5

2

3

4

5

6

4

7

=KURT([Col1], [Col2], [Col3], [Col4], [Col5], [Col6],[Col7],[Col8],[Col9],[Col10])

Kurtosis of the ata set (-0.1518)

Office for iPad videos

Office for iPad videos

What is Office for iPad? It's Word, Excel, and PowerPoint. You can install each of the apps from the App Store for free. The apps have the familiar, unmistakably Office look and feel, along with an intuitive touch experience.

After you install the apps, come back here and watch these tutorial videos. You'll learn how to sign in, open files, and get up and running in no time. You'll also learn how saving works.

Sign in to Office for iPad

Sign in text
Signing in to Office for iPad is easy because you can sign in with almost any kind of Microsoft account or Office 365 account. Watch this video to learn all the details.

Open DropBox files in Office for iPad

DropBox logo
You can open DropBox files in Office for iPad. All you need to do is add DropBox as a place, and then sign in using your DropBox account. Watch this video to get started.

More videos for Office for iPad

  • Training videos for Excel for iPad You'll learn how to open stuff: files in the cloud, and even email attachments. These videos also cover typing in Excel, and selecting things easily. They also cover printing and saving.

  • Training videos for PowerPoint for iPad Learn how to open your slides, edit them, print, and save them. You'll also learn how to start the slideshow, and how to project using AirPlay.

  • Training videos for Word for iPad Word for iPad is great for simply reading files and email attachments, but it's great at editing them too. Check out these videos and learn how to type, select, print and save on your iPad.

XIRR function

XIRR function

This article describes the formula syntax and usage of the XIRR function in Microsoft Excel.

Description

Returns the internal rate of return for a schedule of cash flows that is not necessarily periodic. To calculate the internal rate of return for a series of periodic cash flows, use the IRR function.

Syntax

XIRR(values, dates, [guess])

The XIRR function syntax has the following arguments:

  • Values    Required. A series of cash flows that corresponds to a schedule of payments in dates. The first payment is optional and corresponds to a cost or payment that occurs at the beginning of the investment. If the first value is a cost or payment, it must be a negative value. All succeeding payments are discounted based on a 365-day year. The series of values must contain at least one positive and one negative value.

  • Dates    Required. A schedule of payment dates that corresponds to the cash flow payments. Dates may occur in any order. Dates should be entered by using the DATE function, or as results of other formulas or functions. For example, use DATE(2008,5,23) for the 23rd day of May, 2008. Problems can occur if dates are entered as text. .

  • Guess    Optional. A number that you guess is close to the result of XIRR.

Remarks

  • Microsoft Excel stores dates as sequential serial numbers so they can be used in calculations. By default, January 1, 1900 is serial number 1, and January 1, 2008 is serial number 39448 because it is 39,448 days after January 1, 1900.

  • Numbers in dates are truncated to integers.

  • XIRR expects at least one positive cash flow and one negative cash flow; otherwise, XIRR returns the #NUM! error value.

  • If any number in dates is not a valid date, XIRR returns the #VALUE! error value.

  • If any number in dates precedes the starting date, XIRR returns the #NUM! error value.

  • If values and dates contain a different number of values, XIRR returns the #NUM! error value.

  • In most cases you do not need to provide guess for the XIRR calculation. If omitted, guess is assumed to be 0.1 (10 percent).

  • XIRR is closely related to XNPV, the net present value function. The rate of return calculated by XIRR is the interest rate corresponding to XNPV = 0.

  • Excel uses an iterative technique for calculating XIRR. Using a changing rate (starting with guess), XIRR cycles through the calculation until the result is accurate within 0.000001 percent. If XIRR can't find a result that works after 100 tries, the #NUM! error value is returned. The rate is changed until:
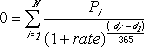
    Equation

    where:

    • di = the ith, or last, payment date.

    • d1 = the 0th payment date.

    • Pi = the ith, or last, payment.

Example

Copy the example data in the following table, and paste it in cell A1 of a new Excel worksheet. For formulas to show results, select them, press F2, and then press Enter. If you need to, you can adjust the column widths to see all the data.

Data

Values

Dates

-10,000

1-Jan-08

2,750

1-Mar-08

4,250

30-Oct-08

3,250

15-Feb-09

2,750

1-Apr-09

Formula

Description (Result)

Result

=XIRR(A3:A7, B3:B7, 0.1)

The internal rate of return (0.373362535 or 37.34%)

37.34%

Manually process data collection replies

Manually process data collection replies

When you collect and update data by using e-mail, you use Access 2007 or Access 2010 with Outlook 2007 or Outlook 2010 to generate and send an e-mail message that includes a data entry form. The recipients of the e-mail then fill out the forms and send them back to you as replies. You must process the replies manually if either of the following cases is true:

  • You did not choose to have Access and Outlook process the replies automatically (that is, if you did not select the Automatically process replies and add data to the database check box in the Data Collection E-Mail Options dialog box when you first created the data collection e-mail message).

  • You did choose to have the replies processed automatically, but the processing failed. In this case, you must troubleshoot the error that caused the failure before attempting to manually process the replies.

    For more information about troubleshooting automatic processing, see the article My data collection replies are not getting automatically processed.

Manual processing of a reply involves starting the export operation from Outlook 2007 or Outlook 2010. You can export only one reply at a time.

Important: Avoid replies for which the Categories column displays a green square. A green square indicates that the message has already been successfully processed.

  1. In Outlook, right-click the reply that you want to process manually.

  2. Click Export data to Microsoft Office Access.

  3. In the Export data to Microsoft Access dialog box, review the details of the reply, and click OK to export.

    If the export operation succeeds, Access displays the message Data successfully exported to the database. If the operation fails, Access displays the message Cannot import data due to errors, followed by a description of the issues that caused the failure.

Top of Page

End of support for Office 2007

End of support for Office 2007

Support for Office 2007 ended on October 10, 2017. All of your Office 2007 apps will continue to function. However, you could expose yourself to serious and potentially harmful security risks. Upgrade to a newer version of Office so you can stay up to date with all the latest features, patches, and security updates.

Link to buy or try Office