Use multiple tables to create a PivotTable
PivotTables are great for analyzing and reporting on your data. And when your data happens to be relational—meaning it's stored in separate tables you can bring together on common values—you can build a PivotTable like this in minutes:
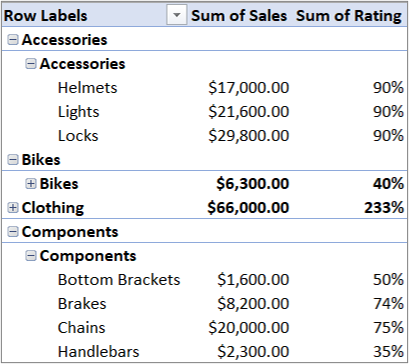
What's different about this PivotTable? Notice how the Field List on the right shows not just one but a collection of tables. Each of these tables contain fields you can combine in a single PivotTable to slice your data in multiple ways. No manual formatting or data preparation is necessary. You can immediately build a PivotTable based on related tables as soon as you import the data.
To get multiple tables into the PivotTable Field List:
-
Import from a relational database, like Microsoft SQL Server, Oracle, or Microsoft Access. You can import multiple tables at the same time.
-
Import multiple tables from other data sources including text files, data feeds, Excel worksheet data, and more. You can add these tables to the Data Model in Excel, create relationships between them, and then use the Data Model to create your PivotTable.
Here's how you'd import multiple tables from a SQL Server database.
-
Make sure you know the server name, database name, and which credentials to use when connecting to SQL Server. Your database administrator can provide the necessary information.
-
Click Data > Get External Data > From Other Sources > From SQL Server.
-
In the Server Name box, enter the network computer name of the computer that runs SQL Server.
-
In the Log on credentials box, click Use Windows Authentication if you're connecting as yourself. Otherwise, enter the username and password provided by the database administrator.
-
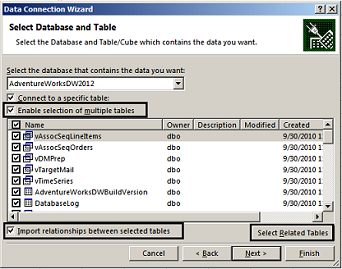
Press Enter and, in the Select Database and Table box, choose the database you want, then click Enable selection of multiple tables.
-
If you know exactly which tables you want to work with, manually choose them. Otherwise, pick one or two, then click Select Related Tables to auto-select tables that are related to those you selected.
-
If the Import relationships between selected tables box is checked, keep it that way to allow Excel to recreate equivalent table relationships in the workbook.
-
Click Finish.
-
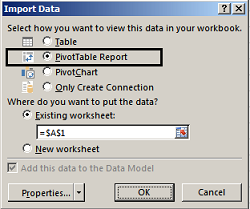
In the Import Data dialog box, choose PivotTable Report.
-
Click OK to start the import and populate the Field List.
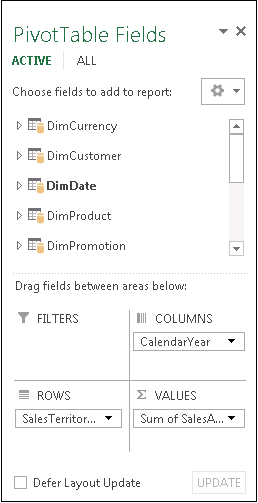
Notice that the Field List contains multiple tables. These are all of the tables that you selected during import. You can expand and collapse each table to view its fields. As long as the tables are related, you can create your PivotTable by dragging fields from any table to the VALUES, ROWS, or COLUMNS areas.
-
Drag numeric fields to the VALUES area. For example, if you are using an Adventure Works sample database, you might drag SalesAmount from the FactInternetSales table.
-
Drag date or territory fields to the ROWS or COLUMNS area to analyze sales by date or territory.
-
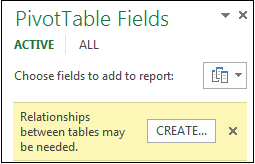
Sometimes you need to create a relationship between two tables before you can use them in a PivotTable. If you get a message indicating a relationship is needed, click Create to get started.
If you're working with other types of databases:
-
To use other relational databases, such as Oracle, you might need to install additional client software. Check with your database administrator to find out if this is required.
-
You can import multiple tables from Access. See Tutorial: PivotTable data analysis using a Data Model in Excel for details.
-
Import tables from other sources
In addition to SQL Server, you can import from a number of other relational databases:
Relational databases are not the only data source that lets you work with multiple tables in a PivotTable Field List. You can use tables in your workbook, or import data feeds that you then integrate with other tables of data in your workbook. To make all this unrelated data work together, you'll need to add each table to the Data Model, and then create relationships between the tables using matching field values.
Use the Data Model to create a new PivotTable
Perhaps you've created relationships between tables in the Data Model, and are now ready to use this data in your analysis. Here's how you build a new PivotTable or PivotChart using the Data Model in your workbook.
-
Click any cell on the worksheet.
-
Click Insert > PivotTable.

-
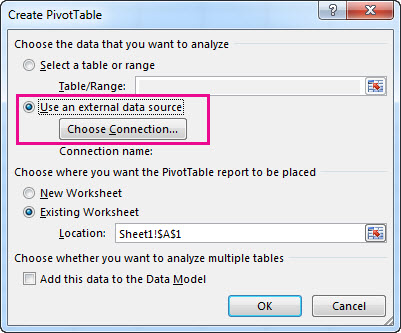
In the Create PivotTable dialog box, under Choose the data that you want to analyze, click Use an external data source.
-
Click Choose Connection.
-
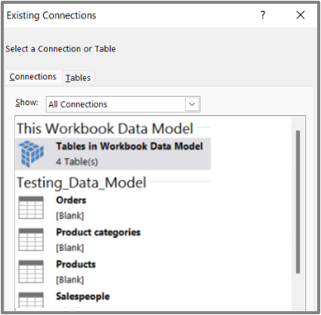
On the Tables tab, in This Workbook Data Model, select Tables in Workbook Data Model.
-
Click Open, and then click OK to show a Field List containing all the tables in the Data Model.
No comments:
Post a Comment