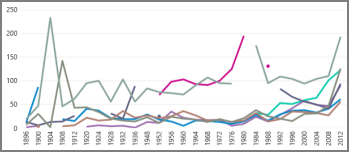
Line charts in Power View
Line charts are great for displaying data over time, or other sequential data.

-
Start with an Excel workbook or other data source that contains your data.
-
In a Power View sheet, create a table with:
-
A field containing the values you want to plot.
-
A date/time or other sequential field.
-
-
With the table selected, on the Design tab > Line.
The date/time field should go in the Axis box and the value field in the Values box. If they don't, move them in the Fields List.
That's the basic line chart.
No comments:
Post a Comment