What's new in Excel 2016 for Windows
As an Office 365 subscriber, you regularly get new and improved Office 2016 features. Take a look below to see what's available to you today.
Latest updates for Excel for Windows Desktop
There are no new features in the September 2017 update. Version 1709 (Build 8528.2139) just contains fixes and improvements. See Previous Releases below to view the most recent features added to Excel.
Find your Office version
Want new features first?
Become an Office Insider and you'll be first in line to see new features and tell us what you think.

Grow your Office skills


More about releases
When do I get new features?
New Office 365 features are sometimes rolled out over a period of time to all subscribers.
Complete list of all updates
Get information about all the channel releases for Office 365 client applications.
New for non-subscribers
Not an Office 365 subscriber but using Office 2016? Find out what's available in your version.
Previous releases
August 2017 updates
See what's new and improved in the August 2017 feature update, Version 1708 (Build 8431.2079).
Find your Office version
Insert 3D models to see all the angles
Use 3D to increase the visual and creative impact of your workbooks. Easily insert a 3D model, then you can rotate it through 360 degrees.
Download a template and give the feature a try!

Work faster. Get more done.

Bring on those complex workbooks with multiple sheets. Excel opens them faster, so you can crunch formulas with large ranges, filter lots of rows, or copy and paste quicker.
New ink effects

Express your ideas with flair using metallic pens and ink effects like rainbow, galaxy, lava, ocean, gold, silver, and more.
July 2017 updates
See what's new and improved in the July 2017 feature update, Version 1707 (Build 8326.2058).
Find your Office version.
Collaborative editing

Work with others at the same time in your workbook. You and your colleagues can open and work on the same Excel workbook. This is called co-authoring. When you co-author, you can see each other's changes quickly — in a matter of seconds.
Excel saves for you

Changes are saved automatically for workbooks stored in the cloud, and you can see others' updates in seconds. Save your files to OneDrive, OneDrive for Business, or SharePoint Online.
Helpful sounds improve accessibility

Turn on audio cues to guide you as you work. Find it in Options > Ease of Access. No add-in needed.
June 2017 updates
See what's new and improved in the June 2017 feature update, Version 1706 (Build 8229.2073).
Find your Office version.
Customizable, portable pen set

Create a personal set of pens to suit your needs. Office remembers your pen set in Word, Excel, and PowerPoint across all your Windows devices.
Quick access to superscript and subscript

Keep the superscript and subscript commands at your fingertips by adding them to the Ribbon or Quick Access Toolbar.
Updates for Get & Transform and the Power Query add-in
-
More enhancements when you add a column from examples: In the Query Editor, Column from Examples has been improved to support suggestions, more Date/Time operations, and additional transformations.
-
New Azure Data Lake Store connector: We're always working to add new connectors. Now you can import data from an Azure Data Lake Store analytics service.
May 2017 updates
See what's new and improved in the May 2017 feature update, Version 1705 (Build 8201.2075).
Find your Office version.
Enhanced data import functionality
Easily import and shape data from various sources. Manage workbook queries and connection with the Queries & Connection side pane, and share queries with others via ODC files.

New data transformation: Add Column From Examples

In the Query Editor, create a new column by providing sample values. As you type, Excel detects the required transformations and shows a preview of the new column.
Keep the copy

We listened to your feedback! With this update you can copy your cells, and before you paste, you can still do other tasks like typing or inserting cells.
 | Important: As of March 31, 2017, data services are no longer available from Azure Marketplace. Please reach out to your service provider for options if you want to continue service. |
April 2017 updates
See what's new and improved in the April 2017 feature update, Version 1704 (Build 8067.2115).
Find your Office version.
Personalize the default PivotTable layout
Set up a PivotTable the way you like. Choose how you want to display subtotals, grand totals, and the report layout, then save it as your default. The next time you create a PivotTable, you will start with that layout.
LEARN MORE: SET PIVOTTABLE DEFAULT LAYOUT OPTION | CREATE AND FORMAT PIVOTTABLES WITH FREE TRAINING FROM LINKEDIN LEARNING
Insert recent links

Easily attach hyperlinks to recent cloud-based files or websites, and create meaningful display names for people using screen readers. To add a link to a recently used file, on the Insert tab, choose Link and select any file from the displayed list.
Join the Excel Community
Learn how to use Excel, discuss your work, share tips & tricks, and connect with experts who build and use the product. The community helps answer your product questions with responses from other knowledgeable community members.
Updates for Get & Transform and the Power Query add-in
-
New transformation – Add Column by Example: In the Query Editor, create a new column by specifying a set of examples of the desired output. Based on these examples, Excel will automatically detect and apply the required transformations.
This means you don't have to have expertise in algorithms or complex logic for transforming or extracting data from other columns, or how to define those transformations in the Query Editor.
-
New transformation – Split Column (by delimiter/number of characters) into rows: A new option in the Split Column by Delimiter and Split Column by Number of Characters transformation dialogs allows you to specify whether to split into new columns (previous default behavior) or split into new rows. Find this new option in the Advanced Options section of either dialog.
-
New transformation – Basic mode for Group By operation: In the Group By transform dialog, use the new Basic mode to group by a single column, and define a single output column. Switch between Basic and Advanced modes by selecting either option at the top of the dialog.
-
"Go to Column" in Query Editor: Quickly find columns in the Query Editor by choosing Home > Go to Column in the Query Editor ribbon. Search the list of columns and select the column you want to scroll into preview and select.
-
SAP HANA Connector – Enhancements to Parameter Input UX: The Parameter Input UX for SAP HANA connector has been improved. You can filter the list of parameters to "only required parameters". The new popup dialog for single or multi-selection input controls lets you easily view the ID and Caption for each parameter value, as well as search within the list of values by any of these two fields. This makes it easier to provide input values as well as input IDs.
March 2017 updates
See what's new and improved in the March 2017 feature update, Version 1703 (Build 7967.2139).
Find your Office version.
Introducing the Dubai font
Try the latest high-quality font family, optimized for legibility, and supporting Arabic and Western European languages.
Updates for Get & Transform and the Power Query add-in
-
Combine Binaries – Ability to specify a sample file to use: The Combine Binaries experience has improved thanks to your feedback. With this release, you can choose which sample file to use to select objects or specify custom transformation steps. The default selection is the first file found in the folder, but you can easily customize it.
-
Split Column by Delimiter – Automatic detection of delimiter character: When you split columns by delimiter using the Query Editor (Home > Split Column), Excel will automatically populate the Delimiter field based on what it sees in the data preview rows. If necessary, you can still change the delimiter.
-
DB2 Connector – Option to specify Package Collection: In the Advanced Options section of the DB2 connector dialog, specify the package collection to connect to, within a given DB2 server. Note that this option can only be used with the Microsoft IBM DB2 driver.
February 2017 updates
See what's new and improved in the February 2017 feature update, Version 1702 (Build 7870.2020).
Find your Office version.
Easier background removal

We've made it easier to remove and edit the background of a picture. Excel automatically detects the general background area, so you no longer need to draw a rectangle around the foreground of your picture.
You can now also draw free-form lines using the pencil  for marking areas to keep or remove—no more being limited to drawing just straight lines.
Updates for Get & Transform and the Power Query add-in
-
Support for the same file extensions in Text and CSV Connectors: We have revised the list of supported file extensions in the From Text and From CSV connectors. Browse and select any text (*.txt), comma-separated value (*.csv), or formatted text space delimited (*.prn) file, as the first step of the import flow for both connectors. Switch to the "All files (*.*)" filter option to import data from any other unlisted file.
-
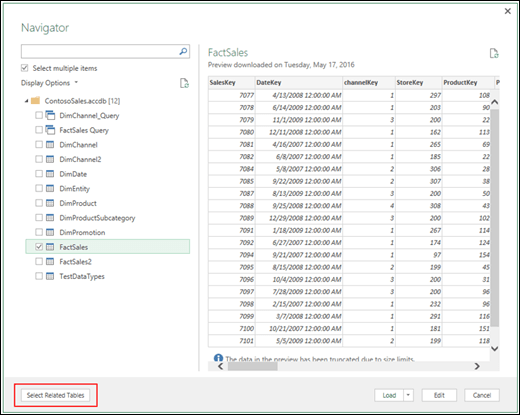
ODBC and OLEDB Connectors – Support for "Select Related Tables": We have enabled the Select Related Tables button in the Navigator dialog, when using the ODBC and OLEDB connectors. This option, which is already available for other relational data sources, allows you to easily select tables that are directly related to the set of already selected tables in the Navigator dialog.
-
Enhanced Folder Connector – Support for "Combine" from the Data Preview dialog: In a previous update, we shipped a set of enhancements to the "Combine Binaries" experience. We've made further improvements to the feature this month. You can combine multiple files directly from the folder Data Preview dialog within the Get Data flow, without having to go into the Query Editor. Use the Combine or Combine & Load options to further refine your data before loading it into the Data model.
-
"Change Type Using Locale" option in Column Type drop-down menus inside Query Editor: In the Query Editor, you can view and modify column types using the Column Type drop-down menu in the preview area. With this release, we have added the Change Type Using Locale option to this drop-down (previously available when you right-click on the column header > Change Type > Using Locale). This option specifies the desired column type and locale to use for the conversion, and changes how text values are recognized and converted to other data types, such as Dates, Numbers, etc.
-
"Insert Step After" option in Steps pane inside Query Editor: Use the new context menu option in the Query Editor window to easily insert new steps in existing queries. Insert a new custom step right after the currently selected step, which can be the final step or any previous step within the query.
January 2017 updates
See what's new and improved in the January 2017 feature update, Version 1701 (Build 7766.2060).
Find your Office version.
Updates for Get & Transform and the Power Query add-in
-
Enhanced SQL Server connector - Support for SQL Failover: We've improved the SQL Server connector and added a new option to enable SQL Server Failover. This MSDN article has more information about this option. This new option can be found in the Advanced Options section of the SQL Server connector dialog.
-
New transformation - Horizontal List Expansion: We've made it easier to extract data values from a column containing nested lists. Previously, you could expand nested lists within a table column, resulting in one new table row for each item within the nested list. This transformation can be found in the column headers in a List column, or by choosing Expand on the ribbon.
After selecting this option, you will be prompted to provide a delimiter to use in the new column. You will be asked to choose from a list of predefined delimiters, or specify a custom delimiter, which may also include special characters. The transformation will turn the column with nested lists into a text column.
December 2016 updates
See what's new and improved in the December 2016 feature update, Version 1612 (Build 7668.2066).
Lasso Select at your fingertips
Excel now has Lasso Select  , a free-form tool for selecting ink. Drag with the tool to select a particular area of an ink drawing, and then you can manipulate that object as you wish. For more information, see Draw and write with ink in Office.
Use your digital pen to select and change objects
In Excel, with a digital pen, you can select an area without even tapping the selection tool on the ribbon. Just press the barrel button on the pen and draw with the pen to make a selection. Then you can use the pen to move, resize, or rotate the ink object. For more information, see Draw and write with ink in Office.
View and restore changes in workbooks that are shared
Quickly view who has made changes in workbooks that are shared, and easily restore earlier versions. For more information, see View historical versions of Office files.
Updates for Get & Transform and the Power Query add-in
-
New OLEDB connector: In this update we're enabling connectivity to OLEDB drivers via the new OLEDB connector. In addition to the wide range of out-of-the-box sources supported, OLEDB greatly increases the number of sources that the users can now import from by using Get & Transform capabilities in Excel.
-
Enhanced "Combine Binaries" experience when importing from any folder: One of the most popular scenarios in Excel consists on leveraging one of the folder-like connectors (such as Folder, SharePoint folder, etc.) to combine multiple files with the same schema into a single logical table.
-
Support for percentage data type: With this update, we're adding support for percentage data types so they can easily be used in arithmetical operations for Get & Transform scenarios. An input value such as "5%" will be automatically recognized as a percentage value and converted to a 2-digit precision decimal number (i.e. 0.05), which can then be used in arithmetical operations within a spreadsheet, the Query Editor or the Data Model.
-
Improved "Function Authoring" experience: We're also making it easier to update function definitions without the need to maintain the underlying M code.
-
Improved performance for OData connector: With this update, we're adding support for pushing Expand Record operations to be performed in the underlying OData Service. This will result in improved performance when expanding records from an OData feed.
-
Maximize/Restore buttons in the Navigator and Query Dependencies dialogs:The Navigator and Query Dependencies dialog (activated from Query Editor) support window resizing by dragging the bottom-right edges of the dialog. In this release, we're making it also possible to maximize/restore these dialogs by exposing Maximize and Restore icons in the top-right corner of the dialogs.
For more details on the above, see the Power BI blog.
November 2016 updates
See what's new and improved in the November 2016 feature update, Version 1611 (Build 7571.2072).
New map charts

You can create a map chart to compare values and show categories across geographical regions. Use it when you have geographical regions in your data, like countries/regions, states, counties or postal codes. Watch a quick map chart video here.
New icons available on the Insert tab
Need to insert an icon that conveys a certain idea or concept, but you don't want to draw it yourself? Check out the Icon button on the Insert tab. Choose a category like people, technology, or sports. Then click the icon that represents the idea or concept you have in mind.
Quickly save to recent folders
This feature was highly requested by our customers: Go to File > Save As > Recent, and you'll see a list of recently accessed folders that you can save to.
Accessibility improvements
We now have improved support for Narrator and other assistive technology that lets you read cells, create tables, sort data, and more. See What's new in accessibility for Excel for more information.
October 2016 updates
See what's new and improved in the October 2016 feature update, Version 1610 (Build 7466.2038).
Scalable Vector Graphics
Now you can insert and work with Scalable Vector Graphics (SVG) files. For more information, see Insert SVG images.
New Ink Replay button
Using ink in your spreadsheets? Now you can replay or rewind your ink to better understand the flow of it. Or your peers can replay it to get step-by-step instructions. You'll find Ink Replay on the Draw tab. Give it a try!
Shared with Me
Does this sound familiar? Someone shared a OneDrive file with you, but you can't find the email message that has the link. No problem. With this update, you can click File > Open > Shared with Me. This will show you all files that have been shared with you.
CSV (UTF-8) support
You asked for it on our Excel User Voice forum: You can now open and save CSV files that use UTF-8 character encoding. Go to File > Save As > Browse. Then click the Save as type menu and you'll find the new option for CSV UTF-8 (Comma delimited). CSV UTF-8 is a commonly used file format that supports more characters than Excel's existing CSV option (ANSI). What does this mean? Better support for working with non-English data, and ease of moving data to other applications.
Updates for Get & Transform and the Power Query add-in
-
Web Connector: We have added support for specifying HTTP Request Headers within the Web connector dialog. Users can specify header name/value pairs from the Advanced mode in this dialog.
-
OData Connector: In this update, we have added relationship detection support for OData V4 feeds. When connecting to OData V4 feeds, users will be able to use the Select Related Tables button in the Navigator dialog to help you easily select all the tables needed for your reports.
-
Oracle Connector: We significantly improved the performance for previewing tables in the Navigator dialog when connecting to Oracle databases. In most cases, previews should take up to 30 percent less time to display than before.
-
SAP HANA Connector: We made enhancements to the parameter input controls within the Navigator dialog when connecting to SAP HANA.
-
Query Dependencies view from Query Editor: See all queries and dependencies on other queries or data sources at a glance.
-
Query Editor ribbon support for scalar values: We added Query Editor ribbon support for common operations when dealing with scalar-type queries. This includes new Contextual Ribbon tabs that expose common transformations for Text, Date/Time and Number values.
-
Add custom column based on function invocation: You can now simply leverage the new Invoke Custom Function operation from the Add Column tab on the ribbon.
-
Expand & Aggregate columns provide support for "Load More" values: With this update, we have added the Load More option to the Expand & Aggregate columns list in Query Editor so that users can tell Excel to look at more rows to detect additional nested fields/columns.
-
Convert table column to a list—new transformation: With this update, we made it much easier for users to turn a given column within a table into a list. Simply select the column in the Query Editor Preview and use the newly added Convert to List button in the Transform tab on the ribbon.
-
Select as you type in drop-down menus: With this update, we considerably improved the navigation and selection interactions within drop-down menus with the addition of select-as-you-type capabilities. This allows users to type one or more characters and these will get matched with the prefix of drop-down menu items. This behavior is now available in all Get & Transform drop-down menus, but it is particularly useful for menus with many list items (such as the Change Type with Locale dialog or the single-value parameter lists for SAP HANA, etc.).
For more details on the above, see the Power BI blog.
September 2016 updates
See what's new and improved in the September 2016 feature update, Version 1609 (Build 7369.2024).
New Excel training
The Office Training Center has 10 new Excel courses, created in partnership with LinkedIn Learning. Watch videos at your pace to learn about Excel 2016 including using formulas and analyzing chart data. Also learn how to get unlimited access to over 4,000 video courses from LinkedIn Learning. See all our Excel training.
New feedback command on the File menu
Have a comment or suggestion about Microsoft Office? We need your feedback to help us deliver great products. In Excel, you can suggest new features, tell us what you like or what's not working by clicking File > Feedback.

Updates for Get & Transform and the Power Query add-in
-
Added support for query parameters: You can now add parameters to your queries in the Query Editor. Just click Home > Manage Parameters > New Parameter.


-
Create new queries based on merge/append operations: You can now use merge and append operations to create new queries in the Query Editor. Click the Home tab. Then click the down arrow next to Merge Queries, and then click Merge Queries as New. To append as new, click the down arrow next to Append Queries, and then click Append Queries as New.


-
Improved web connector with page preview: We've improved the web connector experience. Now you can see a live preview of a web page, and select the desired table(s) for importing. Select Data > New Query > From Other Sources > From Web. After you put in your URL and click OK, the Navigator will appear. On the right, click the Web View button. Now scroll through the page. Any table with a tab and border is ready to import. Select the table that you want, and then click either Load or Edit to work it further.
August 2016 updates
See what's new and improved in the August 2016 feature update, Version 1608 (Build 7341.2032).
The Tell Me what you want to do box at the top of the Ribbon has been updated with improved search, content and recommendations to answer your questions better and fast. Now when you enter a search for a certain task, function or question you'll see a wide variety of options. If it's a quick task Excel will try to let you take care of it right from the Tell Me pane. If it's a more complex question, we'll show you help that we think best matches your needs. Try it out to see how fast you can find what you're looking for and get things done.

Updates for Get & Transform and the Power Query add-in
-
Refresh the Query - Keep the Layouts: Formats and calculated columns for data imported using Get & Transform are now preserved after queries refresh.
-
Enhanced SAP HANA connector—allow multi-select of values for variables and parameters: With this update, users can now select more than one value for a given variable or parameter when leveraging the SAP HANA connector. This can be achieved via the Navigator dialog.
-
Enhanced OData connector—option to import Open Type columns from OData feeds: The OData connector now supports importing Open Type columns from OData feeds. Prior to this update, such columns were not supported in Power Query. This option is exposed under the Advanced Options section in the OData connector dialog.

-
Enhanced Access DB connector—new Select Related Tables button to "" in the Navigator dialog: We improved the Access Database connector to enable users to easily select related tables by adding the Select Related Tables button into the Navigator dialog. The behavior when clicking this button is the same as for all other databases that already support this capability—it selects all tables that have a direct relationship to any of the already selected tables.
-
Option to generate Step names in English within the Query Editor: When creating new Steps in the Query Editor based on transformations from the ribbon, the default Step Names will be based on the transformation name (i.e., SplitColumns, FilteredRows, etc.). These step names will be localized to the current installation language for Excel.
With this update, we introduced a new option to allow users to change this default behavior so that auto-generated step names use the English name for that transformation. This allows users to contribute to a single Excel report using multiple localized desktop versions, but keep the Step names recognizable by all parties (i.e., all in English by default). The new configuration setting is available under Data > New Query > Global > Regional Settings for non-English installations.

-
Description for Query Steps within the Query Editor: We also introduced a new Description field for Query Steps within the Query Editor, which gives the users an option to document and provide comments for their query transformations. The new Description field can be accessed from the right-click menu on any Query Step > Properties… command.

-
Extract Week, Day or Month name from a Date/Time column from the Query Editor: With this update, the users can now extract the Week, Day or Month names from a given Date/Time column. We've made this available from the Query Editor ribbon—either via the Transform tab, to modify an existing column, or via the Add Column tab, to insert a new one.
These two options can be found under Date > Day > Name of Day and Date > Month > Name of Month respectively. Note that the Day and Month names are localized according to the local setting for your current file (available under the Data tab > New Query > Query Options > Current Workbook > Regional Settings for your Excel workbook).

-
Merge Dates and Times into a Date/Time column from the Query Editor: Another new transformation this month allows users to combine a Date column and a Time column into a single Date/Time column. This can be achieved by selecting those two columns and clicking Combine Date and Time under Date or Time menus in the Transform or Add Columns tabs respectively.

-
Extract Start/End of Hour from a Date/Time or Time column from the Query Editor: The last new data transformation this month allows users to easily extract the Start or End of an Hour based on a Date/Time or Time column. These two options can be found under the Time > Hour menu in the Transform and Add Column tabs.

-
Refresh the query — keep the layouts: When you use Get & Transform to work with external data, you might want to make formatting changes or layout changes. You may even add a calculated column. Previously, these kinds of changes were not preserved when loading the data into Excel. But with this update, they are. This is because the Preserve column sort/filter/layout checkbox is now turned on by default. (To access this checkbox, click inside an external data table, and then click Design > Properties.)
-
Command timeout available in the From Web connector: Now you can set web queries to time out, in case they take too long. Select Data > New Query > From Other Sources > From Web. Then click Advanced. At the bottom of the dialog, specify how many minutes should occur before the query times out.

-
Support for fixed-width delimited files in the CSV/Text connector: If you have a text or CSV file that contains delimiters between columns, you can set the column widths to specific character positions.
First, start the CSV or From Text connector: Data > New Query > From File > From CSV (or From Text). Then select a file that contains a delimiter between values. Under Delimiter, select --Fixed Width--. Finally, under --Fixed Width--, specify the character position for each column break.

July 2016 updates
See what's new and improved in the July 2016 feature update, Version 1607 (Build 7167.2040).
Publish to Power BI
If you have a Power BI subscription, you can now publish files that are stored locally to Power BI. To get started, first save your file to your computer. Then click File > Publish > Publish to Power BI. After you upload, you can click the Go To Power BI button to see the file in your web browser.
No warnings when saving a CSV file
Remember this warning? "This file may contain features that are not compatible with CSV..." Well, you asked for it! We will no longer show this when saving a CSV file.
Updates for Get & Transform and the Power Query add-in
-
New SAP HANA connector: In this update, we added a new connector to allow you to import data from SAP HANA databases. The new connector can be found under Data > New Query > From Database, or from the Query Editor window. See Connect to an SAP HANA database for more information.

-
New SharePoint Folder connector: Available under Data > New Query > File, the new SharePoint Folder connector enables you to import data from multiple files within a SharePoint folder. This is similar to how the Folder connector, which enables you to import and combine multiple files from a filesystem folder.

-
New Online Services connectors category: With this update, we added a new category that includes all available connectors for Online Services in Excel. The new category is available under Data > New Query > From Online Services, or from the Query Editor window.

-
Improved DB2 connector: In this release, we improved the IBM DB2 connector to provide you the choice of using the Microsoft driver for IBM DB2, which is also automatically included in the Excel/Power Query installation. Within the IBM DB2 connector dialog, you can now select which driver to use under Advanced options.

-
Improved Text/CSV connector, now exposing editable settings in the preview dialog: In this update, we improved the Text and CSV connectors so you can configure basic import settings from within the preview dialog. These import settings include: File Origin, Delimiter, and Detect Data Type (strategies include: Base on top 200 rows, Base on entire dataset, or No data type detection). Based on your choices, the preview in this dialog automatically updates. You can then decide whether to directly load the data, or edit first to apply additional data transformations.

-
Improved relational database: In this update, we enhanced the relational database connectors. There is now an option that allows you to include Schema information as part of the Navigation hierarchy. This option is available under the Advanced option in all database connector dialogs, such as the SQL Server Database dialog below:

-
Data Source Settings enhancements, including "Change Source" capability: You can now easily update the location of a data source for all queries connected to that data source within a single Excel workbook. (Before this update, you had to update the data source location for each of the queries. The new solution allows you to do this in a single step.) Within the Data Source Settings dialog, there is also new Current Workbook scope option, which allows you to limit the list of displayed data sources to only those that are used in the current file. From this view, you can modify credentials, privacy levels and other settings for that data source. Or you can use the Change Source option to modify the location for that data source.

-
Advanced Filter Rows dialog mode within the Query Editor: We're introducing a new mode in the Filter Rows dialog within the Query Editor. This new mode allows you to add multiple filter clauses within a single Filter Rows step. (Before this update, only one to two clauses were allowed.) It also allows you to combine filter clauses based on multiple columns. (Before, all clauses were applied to a single column.)

-
Inline Input controls for Function invocation within the Query Editor: We improved the inline preview for functions within the Query Editor dialog. It now allows input values for function invocation. This new Enter Parameters section in the inline function preview is available for both "out of the box" functions (M Engine functions) as well as user-defined functions.

-
Support for reordering Query Steps within the Query Editor by using drag and drop gestures: We now support reordering of Query Steps within the Query Editor by using drag and drop gestures. This can be done for each query via the Applied Steps section in the Query Editor.

-
Support for input Date values in Filter Rows and Conditional Columns dialogs: In this update, you can now leverage a control to provide input Date values in the Filter Rows and Conditional Columns dialogs.

-
New context menu entry to create new queries from the Queries pane within the Query Editor: You can now add a new query in the Queries pane within the Query Editor. Right-click in the background of the pane or in a query group node. This allows a more intuitive experience for adding new queries when working in the Query Editor pane. Also, when you right-click a query group, the new query is added to the selected group.

June 2016 updates
See what's new and improved in the June 2016 feature update, Version 1606 (Build 7070.2022).
Convert ink drawing to shapes
In an earlier update, you received a new Draw tab when on your touch-enabled device. That tab lets you select inking styles and start making ink annotations. However, with this update, you can convert those ink annotations to shapes. Just select them, and then select Convert to Shapes. That way, you get the freedom of freeform drawing with the uniformity and standardization of Office graphic shapes. To learn more about inking in Office, see Draw and write with ink in Office.
Faster OLAP PivotTables!
If you work with connections to OLAP servers, your PivotTables are now faster. The June 2016 update contains query and cache improvements in this powerful feature's performance. You could benefit from this work, whether you use PivotTables to answer one-off questions, or build complicated workbooks with dozens of PivotTables. It doesn't matter if your PivotTables are connected to a tabular or multi-dimensional model, Any PivotTable connected to Microsoft SQL Server Analysis Services, 3rd party OLAP providers, or the Power Pivot Data Model will likely give you fresh data, faster. Additionally, now if you disable Subtotals and Grand Totals, PivotTables can be much faster when refreshing, expanding, collapsing, and drilling into your data. The bigger the PivotTable, the bigger the potential improvement. Specifically, we have made improvements in three major areas while querying OLAP servers:
-
Improved query efficiency: Excel will now query for Subtotals and Grand Totals only if they're required to render the PivotTable results. This means you wait less for the OLAP server to finish processing the query, and you wait less while waiting for the results to transfer over your network connection. You simply disable Subtotals and Grand Totals from the PivotTable Design tab just like you would normally. See: Show or hide subtotals and totals in a PivotTable.
-
Reduced the number of queries: Excel is smarter when refreshing your data. Queries will now only refresh when they've actually changed and need to be refreshed.
-
Smarter caches: When the PivotTable schema is retrieved, it is now shared across all of the PivotTables on that connection, further reducing the number of queries.
Updates for Get & Transform and the Power Query add-in
-
Conditional Columns: With this update, we're making it extremely easy for users to create new columns in their queries based on values from a different column. A typical use case for this includes creating a set of "buckets" or "categories" based on ranges from a continuous value column. For example, categorizing a person's BMI into "Underweight," "Normal," "Overweight" or "Obese" based on well-known BMI value ranges, or defining categories such as "This Week," "Last Week," etc. based on a Date column. Previously, this could be achieved by creating Custom Columns and capturing the conditional logic with a set of "if-then-else" statements. These expressions can very soon become extremely complex to author and maintain as new conditions are added. Starting with this update, users can now define a set of rules and output values for the new column based on values in other columns within their tables. This can be achieved via the new Conditional Columns dialog, available in the Query Editor under the "Add Column" tab on the ribbon.

-
Column type indicator in Query Editor preview column headers: With this update, we added column type indicators in column headers within the Query Editor preview. These new column type indicators allow you to quickly understand the types for each of the columns in their table, as well as change them to another type by clicking on these indicators or by using the previously available ribbon options (Data Type drop-down menu at the Home tab on the ribbon or Detect Type command under the Transform tab).

-
Reorder Queries and Query Groups inside Query Editor via drag and drop gestures: You can now easily reorder queries and query groups within the Queries pane inside Query Editor by selecting one or multiple objects and dragging and dropping them into the desired destination. This can be used to reorder items within a given group (or top level) and also to move objects into a query group. Adding drag and drop gestures to the Queries pane inside Query Editor greatly improves the user experience for reorganizing queries and query groups, which was previously only possible via Context Menu options.

-
Query Management menu in Query Editor: With this update, we're exposing a new "Manage" drop-down menu for a query within the Query Editor Home tab on the ribbon. This menu exposes common management operations for a query, such as Delete, Duplicate and Reference.

May 2016 updates
See what's new and improved in the May 2016 feature update, Version 1605 (Build 6965.2053).
Updates for Get & Transform and the Power Query add-in
-
Remove blanks via Column Filter menu: With this update, we have added a new data filtering option that will remove all rows where the value for the current column is null or empty. It can be accessed via the Column Filter menu drop-down.

-
Convert Duration values to Years: This new transformation option can be found under the Transform or Add Column tabs. Within the Duration drop-down menu there is a new "Total Years" entry that allows you to calculate total years based on a Duration type column. The logic applied is to divide the total number of days by 365.

-
Keep Duplicates: This new transformation allows users to keep only the rows with duplicated values on the select column(s). Before this update, only "Remove Duplicates" was available. This new option can be found on the ribbon under Home > Remove Duplicates split button and then select the Keep Duplicates command.

-
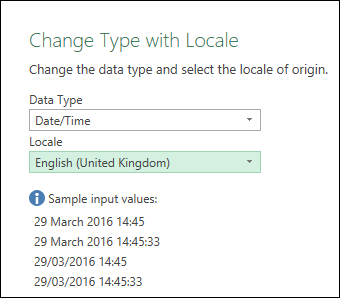
Hints for "sample input values" in the "Change Type with Locale" dialog: Power Query allows users to change the type of a column taking into account the Locale or regional settings/formats in which the data is being represented. This can be done by setting the Locale value for the entire workbook (under Data > New Query > Query Options > Current Workbook > Data Load) and also can be customized for each specific "Change Type" step in the queries. Within the "Change Type with Locale" dialog (accessible by right-clicking on a column header in the Query Editor preview then selecting Change Type > Using Locale…), users can now get a few "sample values" for the expected input format when selecting a specific data type and locale.
-
Support for whitespace and line feeds in the Query Editor preview: With this update, we have added support for visualizing whitespaces in data cells within the Query Editor preview. This includes any whitespace characters, including line feeds. You can toggle between "Show whitespace" (default behavior) and not showing it (old behavior) from the View tab on the Query Editor ribbon.

-
Ability to disable previews from the Navigator window: With this update, we have added an option to disable previews in the Navigator dialog. This allows users to reduce the number of calls being made to the data source in order to retrieve these previews.

-
Technical name support in the Navigator window: Some data sources support the notion of a "technical name" for objects within the source. These "technical names" are meant to provide a more meaningful name for the end user connecting to the data source than the "physical name" for the object. In this update, we added a new option to the Navigator dialog to allow users to switch between "physical name" (previous behavior) and "technical name" (new behavior).
-
Rename queries directly from the Queries pane in the Query Editor: With this update, it is now possible to rename queries directly from the Queries pane inside the Query Editor. To rename a query from this pane, simply select and right-click the query and select Rename, or double-click the query name, or select it and then press F2.

-
Support for Command Timeout in the UX: With this update, users are now able to specify a Command Timeout value (in minutes) when connecting to database sources. This is a significant experience improvement since, before this update, this customization was only possible via custom formula authoring. This new Command Timeout option can be found under the "Advanced options" section in data source dialogs.

-
Set to disable Privacy Level prompts at machine level (including Registry Key): Power Query allows users to combine data from multiple data sources into a single workbook. When dealing with multiple data sources, it is possible for users to define queries that require sending data from one data source to another data source. To prevent accidental disclosure of private or enterprise data, Power Query provides a feature called "Privacy Levels." This feature allows users to specify the Privacy Level (Public, Organizational or Private) for each data source that they connect to when trying to combine data from multiple sources. Based on the selected Privacy Level, Power Query will ensure that data from a Private source is not sent to any other sources and that data from an Organizational source is only sent to sources within the organization. In some cases, this privacy enforcement can get in the way for users who want to define some data combinations that bypass this Privacy feature. Another potential effect of Privacy Levels is that, when combining data from multiple sources that are not supposed to send data between them due to their Privacy Levels, Power Query will compensate and download the data locally to perform the data combination in a secure way. This could result in a performance degradation due to the fact that data would have to be cached locally from all sources implied and combined in-memory. For those cases, users have the ability to ignore Privacy Levels as a "current workbook" setting. However, given that this option was only available per file and per user, it would require a user to enable this option for each workbook they would like to leverage. In addition, ignoring this privacy protection needs to be approved by each user of the workbook, so someone opening a .XLSX file from a different user in their computer would have to either provide Privacy Levels for the data sources involved on the report or manually disable this feature in the Options dialog (under Query Options > Current Workbook > Privacy section).
In this release, we're introducing a new setting to allow users and enterprises to pick one of the following behaviors:
-
Always combine data according to your Privacy Level settings for each source: This new option allows a user to "enforce" that Privacy Levels are taken into account for every .XLSX file on their machine, regardless of whether the "Current Workbook" Privacy Level setting is enabled or disabled.
-
Combine data according to each file's Privacy Level settings: This is the default behavior and matches the Power Query behavior in previous releases.
-
Always ignore Privacy Level settings: This new option allows a user to always bypass Privacy Level settings for every .XLSX file in their machine, regardless of the Current Workbook setting.
These options are available to the user under the Query Options dialog:
")
-
April 2016 updates
See what's new and improved in the April 2016 feature update, Version 1604 (Build 6868.2062).
Updates for Get & Transform and the Power Query add-in
-
ODBC Connector - Support for selecting User/System DSNs: A common request from customers using the ODBC Connector was being able to select from a list of available DSNs on their machine when specifying the connection details in the Import from ODBC wizard in Power Query in Excel. With this update, we added a new drop-down menu so users can select an existing DSN from the list of available User/System DSNs on their machine. In addition to selecting an existing DSN, users can specify additional Connection String details or select "None" in the DSN drop-down to specify a full Connection String independently from any existing DSNs (equivalent to the behavior prior to this update).

-
CSV Connector - Ability to specify Column Delimiter in the Source dialog: We improved the Source dialog for the CSV Connector so that users can customize the Column Delimiter option. Before this update, the Column Delimiter option could only be modified via editing the underlying M formula for the Source step.

March 2016 updates
See what's new and improved in the March 2016 feature update, Version 1603 (Build 6769.2015).
Updates for Get & Transform and the Power Query add-in
-
Filter by not earliest/latest date: We added a new Date/Time columns filter option in the Query Editor to allow users to filter by dates that are not the earliest or latest dates within the current column.

-
Filter by "is in previous N minutes/hours/seconds": Another new Date/Time filter provides the ability to filter out values that are within the previous N minutes/hours/seconds. This can be accessed from the In the Previous… option under the Filter menu for Date/Time columns.
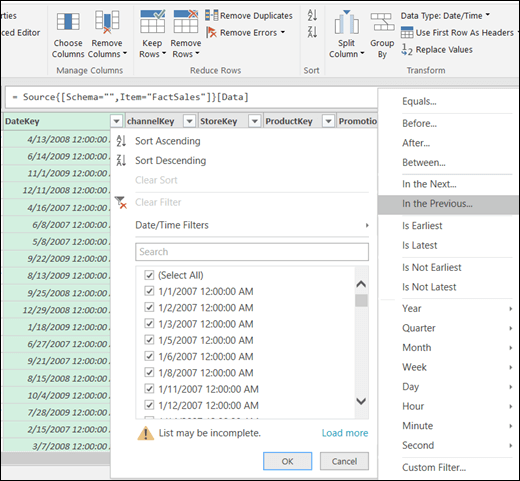
You can then define the filtering options by specifying the value and the desired filtering scope from the drop-down. Note the new hours, minutes and seconds options added in this update.

-
Copy and paste queries between Power BI Desktop and Excel: We know that users often work with multiple tools in their daily activities and use Excel alongside Power BI Desktop for dashboarding and sharing scenarios. In a previous update, the ability to copy and paste queries between different Excel workbooks was enabled. This update makes it seamless for users to copy and paste their queries between Excel and Power BI Desktop. Users can now right-click a query or a query group in the Queries task pane in Excel workbook to copy those queries. They can then paste them into the Queries task pane in Query Editor for Power BI Desktop. Copying the queries from the Power BI Desktop into Excel is done in a similar way.
-
Support for Special Characters in Split Column: Previously, we added support for using Special Characters in the Replace Values dialog to find and replace values. In this update, we enabled the same functionality for Split Column by Delimiter operations.

-
Refresh previews in Merge Queries dialog: It is now possible to refresh the table previews within the Merge Queries dialog so users can select which columns to match using the latest available data.

-
Monospaced font for Query Editor Preview: You can now customize the Query Editor Preview to display content using a monospaced font. This customization option is found under the View tab.

-
Improved function invocation experience: It is now possible to invoke functions directly from within the Navigator dialog. This allows you to invoke and preview results of function invocation against a data source (such as SQL Server). You can now specify the function parameters directly from the Navigator window:

And then preview the results in place:

-
Option to set credentials at the server level: You are now given the chance to set the scope for their credentials when prompted for Database credentials. This is available as a radio button option at the bottom of the Credentials dialog.

-
Add prefix/suffix to a Text column: It is now possible to add a prefix/suffix to an existing Text column via Query Editor—either by using this option under Transform (modify column in place) or under Add Column to create a new column (available under Text Column > Format).

Updates to Power Pivot in Excel 2016
-
Save relationship diagram view as picture: Excel 2016 users can now save the data model diagram view as a high resolution image file that can then be used for sharing, printing or analyzing the data model. To create the image file, in the Power Pivot add-in, click File and then select Save View as Picture.

-
Enhanced Edit Relationship dialog creates faster and more accurate data relationships: Excel 2016 Power Pivot users can now manually add or edit a table relationship while exploring a sample of the data—up to five rows of data in a selected table. This helps create faster and more accurate relationships without the need to go back and forth to the data view every time you wish to create or edit a table relationship.

-
Table selection using keyboard navigation: In the Edit Relationship dialog, type the first letter of a table name to move the first column name starting with the selected letter.
-
Column selection using column navigation: In the Edit Relationship dialog, type the first letter of a column name to move the first column starting with the selected letter. Retype the same letter moves to the next column starting with the selected letter.
-
Auto column suggestion for same column name in both tables: After selecting the first table and column, on the selection of the second table, if a column with the same name exists, it is auto-selected (works both ways).
-
Fixes that improve your overall modeling user experience: 1) The Power Pivot data model is no longer lost when working with hidden workbooks; 2) You can now upgrade an Excel 2010 workbook with a data model to Excel 2016; and 3) You can add a calculated column in Power Pivot, unless it contains a formula.
For a full list in this customer update, visit Power Pivot and the Analysis Services Engine in Excel 2016 fixes.
For all Excel 2016 users, get the latest customer update by installing the following updates. Note, there are 32- and 64-bit versions of each, so be sure to download the right version:
January 2016 updates
See what's new and improved in the January 2016 feature update, Version 1601 (Build 6568.2025).
Funnel Charts
Funnel charts show values across multiple stages in a process. Typically, the values decrease gradually, allowing the bars to resemble a funnel. Read more about funnel charts here.

Improved autocomplete
Excel autocomplete isn't as picky as it was before. For example, let's say you want to use the NETWORKDAYS function, but you can't remember how it is spelled. If you just type =DAYS, the autocomplete menu will bring back all of the functions that contain "DAYS," including, NETWORKDAYS. (Before, you had to spell the function name exactly.)
TEXTJOIN
This function combines text from multiple ranges, and each item is separated by a delimiter that you specify. Learn more about TEXTJOIN here.
CONCAT
This new function is like CONCATENATE, but better. First of all: it's shorter and easier to type. But it also supports range references in addition to cell references. Learn more here.
IFS
Tired of typing complicated, nested IF functions? The IFS function is the solution. With this function, conditions are tested in the order that you specify. If passed, the result is returned. You can also specify an else "catch all" if none of the conditions are met. Learn about IFS here.
SWITCH
This function evaluates an expression against a list of values in order, and returns the first matching result. If no results match, the "else" is returned. Details and examples are spelled out here.
MAXIFS
This function returns the largest number in a range, that meets a single or multiple criteria. More information available here.
MINIFS
This function is similar to MAXIFS, but it returns the smallest number in a range, that meets a single or multiple criteria. Read more about the MINIFS function.
Black Theme
The highest-contrast Office theme yet has arrived. To change your Office theme, go to File > Account, and then click the drop down menu next to Office Theme. The theme you choose will be applied across all your Office apps. To learn more about Office themes, see Change the look and feel of Office 2016 for Windows with Office themes.
September 2015
This initial release provides the first availability of the Office 2016 applications: Version 1509 (Build 4229.1024)
Six new chart types
Visualizations are critical to effective data analysis as well as compelling storytelling. In Excel 2016, we've added six new charts—with the same rich formatting options that you are familiar with—to help you create some of the most commonly used data visualizations of financial or hierarchal information or for revealing statistical properties in your data.
Click Insert Hierarchy Chart on the Insert tab to use the Treemap or Sunburst chart, click Insert Waterfall or Stock Chart for Waterfall, or click Insert Statistical Chart for Histogram, Pareto, or Box and Whisker.

Or click Recommended Charts >All Charts to see all the new charts.

Get and transform (Query)
Before analysis can begin, you must be able to bring in the data relevant to the business question you are trying to answer. Excel 2016 now comes with built-in functionality that brings ease and speed to getting and transforming your data—allowing you to find and bring all the data you need into one place. These new capabilities, previously only available as a separate add-in called Power Query, can be found natively within Excel. Access them from the Get & Transform group on the Data tab.

One click forecasting
In previous versions of Excel, only linear forecasting had been available. In Excel 2016, the FORECAST function has been extended to allow forecasting based on Exponential Smoothing (such as, FORECAST.ETS() …). This functionality is also available as a new one-click forecasting button. On the Data tab, click the Forecast Sheet button to quickly create a forecast visualization of your data series. From the wizard, you can also find options to adjust common forecast parameters, like seasonality, which is automatically detected by default and confidence intervals.

3D Maps
Our popular 3D geospatial visualization tool, Power Map, has been renamed and is now available to all Excel 2016 customers and is built into Excel. This innovative set of storytelling capabilities has been renamed 3D Maps and can be found along with other visualization tools by clicking 3D Map on the Insert tab.

Calendar Insights Financial templates
Take advantage of the new My Cashflow template, and the Stock Analysis template. These templates track what you earn, how much you spend, and where your spending occurs. Plus, quickly analyze and compare the performance of selected stocks over time.
Template
View your calendar as a dashboard and drill into the data. You'll get a better handle on how you spend your time, and identify ways to get more out of your days.
PivotTable enhancements
Excel is known for its flexible and powerful analysis experiences, through the familiar PivotTable authoring environment. With Excel 2010 and Excel 2013, this experience was significantly enhanced with the introduction of Power Pivot and the Data Model, bringing the ability to easily build sophisticated models across your data, augment them with measures and KPIs, and then calculate over millions of rows with high speed. Here are some of the enhancements we made in Excel 2016, so that you can focus less on managing your data and more on uncovering the insights that matter.
Automatic relationship detection discovers and creates relationships among the tables used for your workbook's data model, so you don't have to. Excel 2016 knows when your analysis requires two or more tables to be linked together and notifies you. With one click, it does the work to build the relationships, so you can take advantage of them immediately.
Creating, editing and deleting custom measures can now be done directly from the PivotTable fields list, saving you a lot of time when you need to add additional calculations for your analysis.
Automatic time grouping helps you to use your time-related fields (year, quarter, month) in your PivotTable more powerfully, by auto-detecting and grouping them on your behalf. Once grouped together, simply drag the group to your PivotTable in one action and immediately begin your analysis across the different levels of time with drill-down capabilities.
PivotChart drill-down buttons allow you to zoom in and out across groupings of time and other hierarchical structures within your data.
Search in the PivotTable field list helps you get to the fields that are important to you across your entire data set.
Smart rename gives you the ability to rename tables and columns in your workbook's data model. With each change, Excel 2016 automatically updates any related tables and calculations across your workbook, including all worksheets and DAX formulas.
Multiple usability improvements have also been made. For example, delayed updating allows you to perform multiple changes in Power Pivot without the need to wait until each is propagated across the workbook. The changes will be propagated at one time, once the Power Pivot window is closed.

Multi-select Slicer
Now you can select multiple items in an Excel Slicer on a touch device. This is a change from prior versions of Excel where only one item in a Slicer could be selected at a time using touch input. You can enter Slicer multi-select mode by using the new button located in the Slicer's label.

Publish and share your analysis with Power BI
A report is not complete without being able to share it with the right people. Once you're finished preparing your data analysis, you can share it with your workgroup or clients through Power BI with just one button. Once published to Power BI, use your data models to quickly construct interactive reports and dashboards. With Excel Online support built into Power BI service, you can also display your fully formatted Excel worksheets as well.

Quick Shape Formatting
This feature increases the number of default shape styles by introducing new "preset" styles in Excel.

Insert pictures with the correct orientation
With automatic image rotation, once you insert an image into Excel, it automatically rotates the picture to match the camera's orientation. You can manually rotate the image to any position after insertion. Note that this only affects newly inserted images and does not apply to pictures in existing documents.
Do things quickly with Tell Me
You'll notice a text box on the ribbon in Excel 2016 that says Tell me what you want to do. This is a text field where you can enter words and phrases related to what you want to do next and quickly get to features you want to use or actions you want to perform. You can also choose to get help related to what you're looking for, or perform a Smart Lookup on the term you entered.


Insights into what you're working on
The Insights pane, powered by Bing, offers more than just definitions. When you select a word or phrase, right-click it, and choose Smart Lookup, the insights pane will open with definitions, Wiki articles, and top related searches from the web. You can also get to Smart Lookup any time by going to Review > Smart Lookup and entering a query there.


Ink Equations
Including math equations has gotten much easier. Now, you can go to Insert > Equation > Ink Equation, any time you want to include a complex math equation in your workbook. If you have a touch device, you can use your finger or a touch stylus to write math equations by hand, and Excel will convert it to text. (If you don't have a touch device, you can use a mouse to write, too). You can also erase and select and correct what you've written as you go.


Simpler sharing
Choose Share on the ribbon to share your spreadsheet with others on SharePoint, OneDrive, or OneDrive for Business.
These changes bring together two key aspects of collaboration: who has access to a given document and who is currently working with you on the document. Now you can view both pieces of information in one place from the Share dialog box.

Improved version history
Now you can go to File >History to see a complete list of changes that have been made to your workbook and access earlier versions.

Note: This feature is only supported for files stored on OneDrive for Business or SharePoint.
New Themes

There are now three Office Themes that you can apply : Colorful, Dark Gray, and White. To access these themes, go to File>Options> General, and then click the drop down menu next to Office Theme.
Data Loss Protection (DLP) in Excel
Data Loss Protection (DLP) is a high-value enterprise feature that is well loved in Outlook. We are introducing DLP in Excel to enable real time scan of content based on a set of predefined policies for the most common sensitive data types (e.g., credit card number, social security number, and US bank account number). This capability will also enable the synchronization of DLP policies from Office 365 in Excel, Word, and PowerPoint, and provide organizations with unified policies across content stored in Exchange, SharePoint and OneDrive for Business.

Latest updates for Excel Insiders
If you're an Office Insider enrolled in the Monthly Channel (Targeted) level, keep reading to see what's new in Version 1710 (Build 8625.2055).
If you're enrolled in the faster-paced Insider level, skip this article and see Update history for Office Insider.
Note: We recently changed the level names for the Office Insider for Windows Desktop program. Insider Fast is now called Insider and Insider Slow is now Monthly Channel (Targeted). For more information, see Changes to Slow/Fast level names for Office Insider for Windows desktop.

Learn with the new Office Training Center

Do more with Excel using new templates, tips, and guides - all in the new Office Training Center.
Even more features, even faster
All new features for Office Insiders
Find out all the new features across all Office apps and version and build information.
Want new features faster?
Enroll in the Office Insider FAST level and get access see the latest features even earlier.
Be a part of the community

Office Insider community
Connect with people who are as interested in technology as you are, and get support from the Office Insider community.

Follow us on @OfficeInsider
Join the growing community of experts and enthusiasts who are helping shape the future of Office.
Where to send feedback
We'd love to hear your thoughts about what works, what doesn't, and where you think we can improve. To report issues or send feedback, click File > Feedback from any Office 2016 app. You can also reach us by posting in the Office Insider community or tweeting at @OfficeInsider.
Very Nice article,Thank you for sharing this awesome Blog..
ReplyDeleteKeep Updating...
Power BI Course
sharing this content definetely pop up the ideas
ReplyDeleteAdvanced Excel Formula
Advanced Excel Help
Microsoft Office Tutorials: What'S New In Excel 2016 For Windows >>>>> Download Now
ReplyDelete>>>>> Download Full
Microsoft Office Tutorials: What'S New In Excel 2016 For Windows >>>>> Download LINK
>>>>> Download Now
Microsoft Office Tutorials: What'S New In Excel 2016 For Windows >>>>> Download Full
>>>>> Download LINK v3
Microsoft Office Tutorials: What'S New In Excel 2016 For Windows >>>>> Download Now
ReplyDelete>>>>> Download Full
Microsoft Office Tutorials: What'S New In Excel 2016 For Windows >>>>> Download LINK
>>>>> Download Now
Microsoft Office Tutorials: What'S New In Excel 2016 For Windows >>>>> Download Full
>>>>> Download LINK nE