Introduction to the Report Center
Your business process may require that reports be displayed and kept current on your company's intranet site. With the Report Center, you can more easily author, display, manage, and locate your reports. This article introduces you to the main components of the Report Center.
In this article
What is the Report Center?
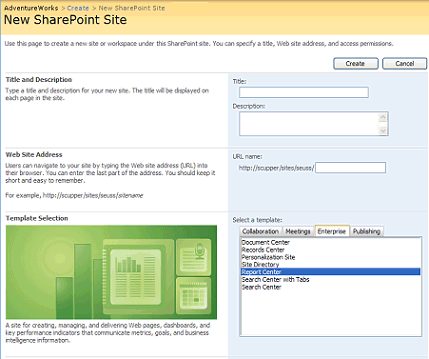
The Report Center is a site template that is optimized for managing and displaying reports, dashboard pages, and key performance indicators (KPIs). It can serve as the central location for a team, department, or organization to store, retrieve, and modify shared reports. With the appropriate permissions, anyone can create a Report Center site anywhere in a site collection.

By default, however, one Report Center is created in the top-level site of each site collection, and appears on the top link bar as a tab named Reports.

The Report Center contains a special document library for browsing Office Excel 2007 workbooks, SQL Reporting Services reports, dashboards, and other reports. Use the Report Center to define personalized reports and dashboards, to browse reports by category, or to view a calendar of upcoming reports and to subscribe to ones that are relevant.
To customize what data can be viewed by whom, you can connect a variety of Filter Web Parts to existing Web Parts on a dashboard page to change the view of the data. For example, a sales manager for one region can be presented with a view of sales figures different from the view for a sales manager for another region.
What is a dashboard page?
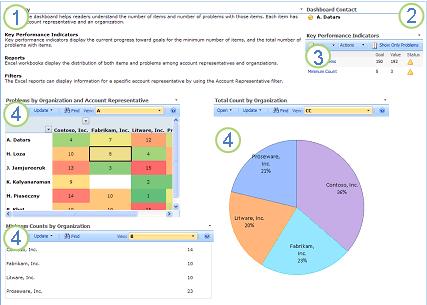
A dashboard page is an important aspect of the Report Center. Dashboards are tools that are used to communicate status and to drive action. An Office SharePoint Server 2007 dashboard is a Web page template that allows you to assemble and display information from disparate sources such as reports, charts, metrics, and key performance indicators. You can create your own dashboard page by using various Web Parts, or you can add Web Parts to pages that already exist in your site. You can familiarize yourself with some of these Web Parts in the following example.

1. Content Editor Web Part — used for formatted text, tables, and images
2. Contact Details Web Part — used to display details about a contact for this page or site
3. Key Performance Indicators Web Part — shows a list of status indicators that display progress toward a goal
4. Excel Web Access Web Parts — These three areas use Excel Web Access to interact with an Excel workbook and to display workbook data on the page.
Overview of the Report Center home page
The main component of the Report Center is the home page that appears when you click the Reports tab. This page serves as the main portal to access highlighted or summary business information. Information that you choose to display on this page can be updated from various sources and, as with any page on a SharePoint site, the information is presented through a collection of Web Parts. If you have at least the Designer permission level, you can add, delete, modify or rearrange these Web Parts to quickly view and access the business information you need.
Tip: When you first browse to the Report Center home page, Office SharePoint Server 2007 includes links to a sample dashboard, sample data, sample KPIs, and information about the Data Connection Library. You might find it helpful to review the information provided on this page before you customize your home page. Find a link to more information about working with Web Parts in the See Also section.
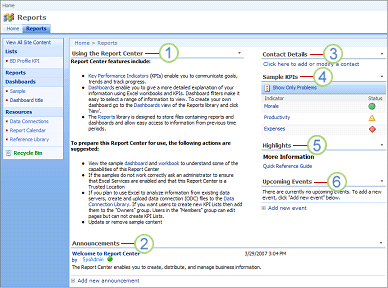
The following illustration shows the main components of the Report Center home page.

1. Provides useful information for first-time users of the Report Center, including links to a sample dashboard, sample data, sample KPIs, and information about the Data Connection Library.
2. Add important announcements for users of the Report Center.
3. Add or modify contacts connected to your network.
4. Sample KPIs are displayed by default on the home page of the Report Center.
5. Add links to important documents or information using this Summary Link Web Part.
6. Add links to events you want to promote on the Home page by using this List View Web Part.
Overview of the components of a Report Center site
On the Quick Launch of the Report Center, there are several lists and libraries that you can use to manage your reports and data connection sources. Storing resources in separate libraries enables you to configure versioning, workflows, and permissions separately for each resource. For example, you can configure the permissions to allow only members of the IT department to modify or upload data connections. Similarly, you can configure workflows in Office SharePoint Server 2007 to require approval for new reports. These lists and libraries are described here.
Reports Library
The Reports Library is the central repository for two types of files: reports and dashboard pages. Reports are Office Excel 2007 workbooks that contain source data that can be displayed in dashboard pages. Dashboard pages can be created from one or more Office Excel 2007 workbooks and use elements such as KPIs and PivotCharts.
Working with the Reports Library is similar to working with other libraries. You can upload existing documents, create new ones, edit documents, modify columns and views, and set permissions. Permissions for reports are set the same way as for any document or list item. You can set permissions on libraries, folders, or individual files. The Reports Library differs from other libraries in that it provides enhanced support for storing and maintaining Excel Services reports and simplifies the creation of dashboard pages, which can display data from KPIs and Office Excel 2007 workbooks. Any dashboard pages that you create are stored in this library. To learn more about Excel Services, see these articles in Getting Started with Excel Services and Excel Web Access.
After reports are created and deployed to the Office SharePoint Server 2007 site, people can navigate to a report in a report library and modify it simply by clicking the file name. Managing reports is as simple as navigating to the correct report in the Reports Library and clicking the down arrow.
Data Connections Library
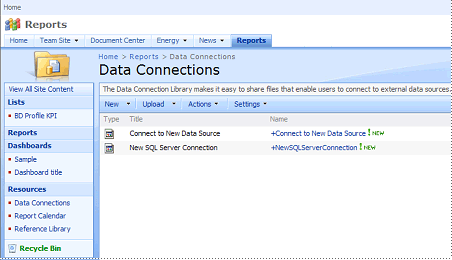
An important part of the Report Center is the Data Connections Library, a shared repository similar to other document libraries, where two different types of data connection files are stored:
-
Office Data Connection (ODC) files contain a set of properties that define how a client application or portal service can connect to a data source. ODCs also define how the security policy should be used when accessing the data source on behalf of a user.
-
Universal Data Connection (UDC) files abstract the data connection information from an Microsoft Office InfoPath 2007 form template by using Single Sign-On (SSO) to handle authentication issues in multi-tier architectures, and by using the Web service proxy available with InfoPath Forms Services. Unlike the ODC format used by other Microsoft Office applications, which stores information about database connections, UDC files can store information about several different types of data connections, and they can be extended to store information about arbitrary types.

One of the key benefits of the Data Connections Library is the ability to reuse the data connections that people are most likely to need access to. For example, when creating an external connection to display a KPI, you can browse the Data Connection Library and select from the available data connection files. If a change occurs on the network that affects one of the connections, modifications can be made one time in the appropriate data connection file on the server. All user connections automatically receive the update the next time the connection to external data is refreshed. Office SharePoint Server 2007 supports connecting to the following external data sources:
-
Office Excel 2007 workbook
-
Office Access 2007 database
-
Other OLEDB or ODBC data source
-
Microsoft SQL Server database
The Data Connection Library provides a high level of control and security with the Content Approval feature turned on by default. Members of the site with the Contribute permission level can save files to the library, but only the owner of the file can use the file, from Office InfoPath 2007 for example, unless a content approver has approved the file. By default, all members with the Designer permission level have the Approve Items permission. In summary, you can set up a site collection so that only those whom you designate can approve the UDC files.
Note: Data connections should be configured by your administrator or someone familiar with the underlying data sources and your network infrastructure.
Report Calendar
The Report Calendar is a calendar list that can contain any date-related information for a report or report schedule. For example, you can use the Report Calendar to indicate on which dates report data is refreshed or loaded and to set a reminder using the Alert Me feature. You can manage and analyze calendar information in Office Excel 2007 or Office Access 2007. You can also connect and synchronize the Report Calendar to your Office Outlook 2007 calendar and, as with other Report Center lists, you can modify views, manage list settings, and so on. To learn more about connecting SharePoint calendars to Office Outlook 2007, see the article View and update a SharePoint calendarin the Office Outlook 2007 Help.
Reference Library
The Reference Library serves as a document library where you store documents that can help people with the navigation and usage of the Report Center. The documents in this library should contain everything people need to know to get around the Report Center that you have customized.
No comments:
Post a Comment