Important: In Excel for Microsoft 365 and Excel 2021, Power View is removed on October 12, 2021. As an alternative, you can use the interactive visual experience provided by Power BI Desktop, which you can download for free. You can also easily Import Excel workbooks into Power BI Desktop.
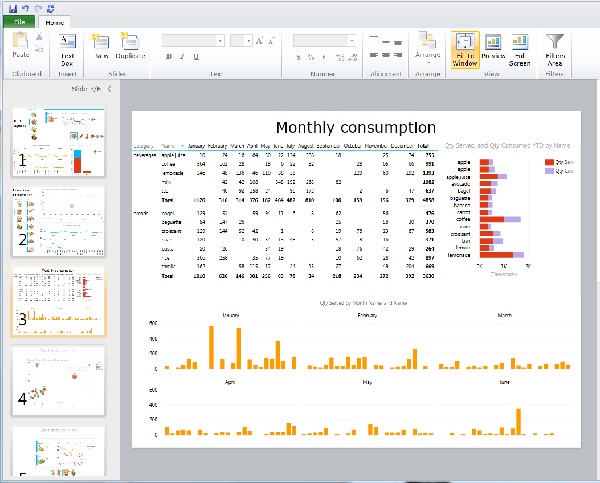
In Power View in SharePoint, you can create a single report with multiple views. All the views in one report are based on the same Data Model. You can copy and paste from one view to another, and duplicate whole views. If you save preview images of the views, an image of each view is displayed in the Power Pivot Gallery in SharePoint Server 2013.
Notes:
-
There are two versions of Power View: Power View in Excel 2013 and Power View in SharePoint 2013. This topic is only about Power View in SharePoint 2013.
-
You can create Excel workbooks with multiple Power View sheets in an Excel workbook. Read about everything else you can do in Power View.
In this article

Add a new view to a report
-
Open the report that you want to add the new view to.
-
On the Home tab, click New View > New View.
The new view is displayed in the left pane.
Add a duplicate view to a report
-
Open the report that you want to add the duplicate view to.
-
On the Home tab, click New View > Duplicate View.
The duplicate view is displayed in the left pane.
Navigate among views
In any mode, you can use the up and down arrow keys to navigate to the different views in a report.
In design mode, you can click the views in the View pane.
In reading and full-screen modes, you can:
-
Click the view chooser button in the lower-left to show a row of the views in the report.

-
Click the navigation arrows in the lower-right.
-
Press the arrow keys.
Filters on views
Each view can have its own filters, but the state of the Filters Area is constant: if the Filters Area is expanded on one view, it's expanded in all views. As you move from view to view in any mode, the state of the filter on each page persists: for example, if you have a filter for the Product Category field filtering one view for cell phones, when you leave the view and return to it, the filter is still filtering for cell phones. When you duplicate a view, the filters are duplicated, too, along with the state of each filter. Saving the report saves the state of each filter.
Saving view preview images
View preview images are the images that Power View displays in the View pane in design mode. When you save a Power View report, by default these images are saved with the report. They are then displayed in the Power Pivot Gallery in SharePoint Server 2013, just as Microsoft Excel worksheets are displayed. However, you have the option not to save them.
Caution:
-
Consider not saving preview images if they display information that you consider potentially sensitive
-
See Choose Whether to Save an Image of Each View with the Report.
Microsoft Office Tutorials: Reports With Multiple Views In Power View In Sharepoint >>>>> Download Now
ReplyDelete>>>>> Download Full
Microsoft Office Tutorials: Reports With Multiple Views In Power View In Sharepoint >>>>> Download LINK
>>>>> Download Now
Microsoft Office Tutorials: Reports With Multiple Views In Power View In Sharepoint >>>>> Download Full
>>>>> Download LINK yS