Quick Analysis takes a range of data and helps you pick the perfect chart with just a few commands.

-
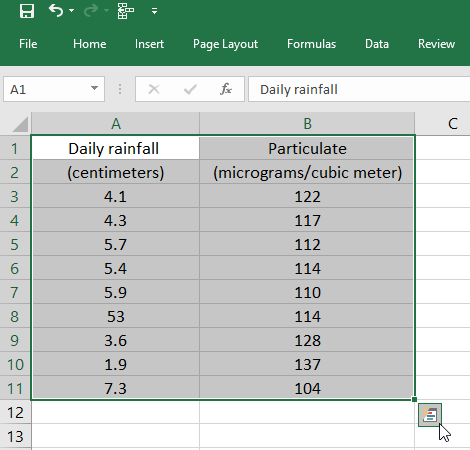
Select a range of cells.
-
Select the Quick Analysis button that appears at the bottom right corner of the selected data.
Or, press Ctrl + Q.
-
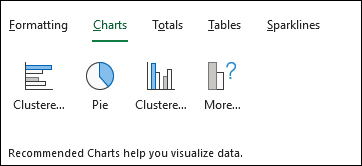
Select Charts.
-
Hover over the chart types to preview a chart, and then select the chart you want.
Need more help?
You can always ask an expert in the Excel Tech Community or get support in the Answers community.
No comments:
Post a Comment