Working with a Report Center site
Microsoft Office SharePoint Server 2007 includes a Report Center site template, which organizations can use to create a site for managing reports and displaying and working with business intelligence data. Organizations can create a Report Center site to consolidate access to business intelligence data in a centralized location. Sites created from the Report Center site template have features that make it easy to:
-
Organize and manage spreadsheets, reports, and data connections.
-
Create key performance indicators (KPIs) to measure progress against business goals.
-
Display business data in dynamic, personalized dashboards.
Depending upon your business needs, you can create a Report Center site to deliver business intelligence information broadly across your organization, or you can restrict access to a Report Center site to the specific teams or groups that must work with this business data.
Note: This article refers to an example SharePoint site created by Adventure Works, a fictitious company that manufactures bicycles, bicycle components, and bicycling accessories.
At Adventure Works, the Sales department uses a Report Center site to create, track, share, and store the department's sales and financial data. Team members work with Microsoft Office Excel 2007 workbooks that have been published to the Report Center site as interactive reports by using Excel Services, a Office SharePoint Server 2007 technology. They can also track sales progress by monitoring KPIs and review sales information in personalized dashboards. The following figure shows the home page for the department's Report Center site, which has been customized to display a KPI Web Part showing information about quarterly sales.

Manage spreadsheets, reports, and data connections
The Report Center site includes several features that can help you organize not only reports but also the connections to external data sources that those reports may use.
Reports Library
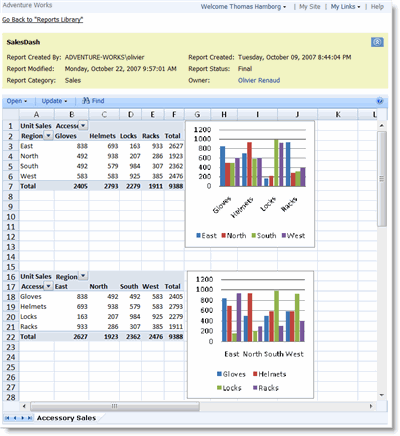
The Reports Library on a Report Center site is the central place where you can create and save both reports (Office Excel 2007 workbooks) and dashboard pages. Reports and dashboard pages are the default content types available for a Reports Library. When you publish an Excel workbook to a Reports Library in the Report Center, it is single-click enabled to open in browser view, which is a convenient way to see the workbook without adding it to a Web Part Page. The following figure shows a report in a browser window.

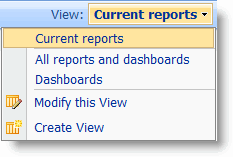
Dashboard pages contain one or more Web Parts, such as business data Web Parts, Excel Web Access Web Parts, or KPI Web Parts, that can be filtered to provide a unified but flexible view of data and content from several different sources. The Reports Library makes it easy to manage many reports and dashboards. The following figure shows the View menu for the Reports Library, which you can use to filter your view to display reports, dashboard pages, or all content saved in the library.

Data Connection Library
A Report Center site also includes a Data Connection Library, which is a special SharePoint document library that makes it easy to store, secure, share, and manage Office data connection (.odc) files. An .odc file is a type of data connection file that uses HTML and XML to store the connection information for external data sources, such as business applications or databases. You can view or edit the contents of an .odc file in any text editor.
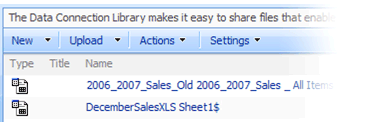
For example, if your organization has Excel workbooks that connect to information in one or more external data sources, such as a database or an OLAP cube, then these data connections contain information about how to locate, log on, query, and access the external data source. Although this connection information can be stored in the workbook itself, it is often stored in an .odc file, especially when the data is shared by many users and the connection information must be updated. By saving these .odc files to the Data Connection Library on a Report Center site, you can ensure that all the data connection files your organization needs for its reports are in one central location where they can be easily managed, updated, and reused for new reports. The following figure shows files in a Data Connection Library.

Report Calendar and Reference Library
A Report Center site also features some additional tools to help you manage reports and business intelligence data. You can use the Report Calendar to schedule the report creation process, or to communicate information about the frequency with which reports are created or refreshed. You can use the Reference Library to store and share process-related information for the people who use your site.
Use KPIs to communicate goals and status
A KPI is an easy-to-understand graphical indicator that communicates progress against a predefined measure or goal. KPIs are valuable tools that help teams, managers, and businesses quickly evaluate their progress against measurable goals.
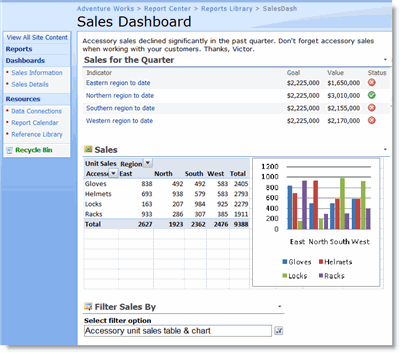
For example, a KPI can use traffic light icons to indicate that a specific business effort is exceeding, meeting, or failing to meet goals. The Sales department at Adventure Works uses a KPI list to track their progress against their quarterly sales goals. If their sales totals for a specific fiscal quarter exceeds a preset goal, the KPI for that quarter is displayed with a green traffic light icon. If the sales total for a quarter does not meet a minimum goal, the KPI for that quarter is displayed with a red traffic light icon. Otherwise, it is displayed with a yellow traffic light icon. The following figure shows a KPI Web Part that displays the quarterly sales KPI information on the home page of the Report Center site for the Sales Department.

KPIs increase the speed and efficiency of evaluating progress against key business goals. Without KPIs, employees and business managers would have to painstakingly extract performance data and evaluate that data against goals, and then spend the time to present that data in a separate report for business decision-makers. It is difficult to get timely status without a way to quickly and automatically evaluate live data. With KPIs, users who want to see the current performance can look quickly at a report on their business site, or even see relevant indicators on their personal sites.
KPIs connect to business data from various sources, and then use Web Parts that display that information in a list of KPIs or in a detailed view for a single KPI. Those Web Parts can be added to dashboards in the Report Center site, or displayed in other lists and sites. Each KPI receives a single value from a data source, either from a single property or by calculating averages across the selected data, and then compares that value against a preselected value. Because values are calculated across a range of data, instead of displaying data in list form, KPIs are generally more useful when measuring performance across groups or projects. However, by calculating a range of data for a specific person, such as a list of sales for a single employee, a KPI can evaluate individual performance.
To create a KPI, you first create a KPI list to which you add one or more KPIs. You can create new indicators in a KPI list by using any of the following:
-
Data in SharePoint lists.
-
Data in Excel workbooks.
-
Data from Microsoft SQL Server 2005 Analysis Services.
-
Manually entered information.
Create dynamic visual dashboards
Dashboards are special Web Part Pages that display business data from a variety of different sources. Dashboards can display both reports and KPIs about the business data and business processes in your organization. The data displayed in dashboards can be filtered automatically or filtered by properties selected by users, enabling comparative data analysis across an organization.
Dashboards are composed of business data Web Parts and filter Web Parts, and the filter Web Parts are connected to the business data Web Parts. Some filter Web Parts filter data automatically, while other filter Web Parts enable users to enter values or to select values from a list and then apply those values by clicking the Apply Filter button on the page. The Apply Filter button is implemented as another Web Part that is invisible on the dashboard until one or more filters that have user-specified values are added to the page. The Apply Filter button and user-specified filters appear in a special filter zone in the dashboard template.
The following figure shows a Sales Dashboard on the Sales Report Center site for Adventure Works. This dashboard displays both a KPI Web Part and report information in an Excel Web Access Web Part.

No comments:
Post a Comment