Select data for a chart
To create a chart in Excel Online, you need to select at least one cell in a range of data (a set of cells). Your chart will include all data in that range.
Arrange data for charts
This table lists the best ways to arrange your data for a given chart.
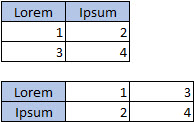
| For this chart | Arrange the data |
| Column, bar, line, area, or radar chart | In columns or rows, like this: |
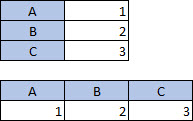
| Pie chart This chart uses one set of values (called a data series). | In one column or row, and one column or row of labels, like this: |
| Doughnut chart This chart can use one or more data series | In multiple columns or rows of data, and one column or row of labels, like this: |
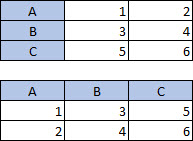
| Scatter chart | In columns, placing your x values in the first column and your y values in the next column, like this: |
For more information about any of these charts, see Available chart types.


No comments:
Post a Comment