Office 365 Reports in the new Admin Center - OneDrive for Business usage
The new Office 365 Reports dashboard shows you the activity overview across the Office 365 products in your organization. It enables you to drill in to individual product level reports to give you more granular insight about the activities within each product. Check out the Reports overview topic.
For example, the OneDrive card on the dashboard gives you a high-level view of the value you are getting from OneDrive in terms of the total number of files and storage used across all the OneDrive accounts in your organization. You can then drill into it to understand the trends of active OneDrive accounts, how many files are users interacting with as well as the storage used. It also gives you the per OneDrive account details.
Note: You must be a global administrator in Office 365 or an Exchange, SharePoint, or Skype for Business administrator to see Office 365 reports.
How do I get to the OneDrive Usage Report?
-
Sign in to Office 365 with your work or school account.
-
Go to the Office 365 admin center.
-
Select Reports and then Usage from the left menu or click on the Reports widget.

-
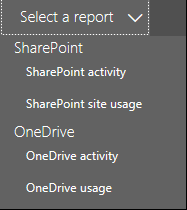
Use the Select a report drop-drop at the top left and select OneDrive usage.

Interpret the OneDrive for Business usage report
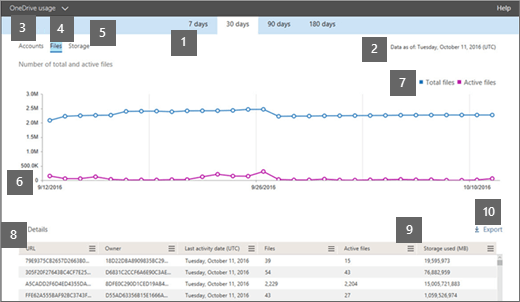
You can get a view into OneDrive for Business usage by looking at the Sites, Files, and Storage views.

| 1 | The OneDrive for Business usage report can be viewed for trends over the last 7 days, 30 days, 90 days, or 180 days. |
| 2 | Each report has a date for when this report was generated. The reports usually reflect a 24 to 48 hour latency from time of activity. Note: At times there may be unpredictable delays in data collection and processing which may delay report generation. The displayed report date is always reflective of the current date for which the system has processed report data. We strive to keep these within 24-48 hours from the time of activity. |
| 3 | The Sites view shows the trend in the number of active OneDrive for Business sites. Any site in which users had viewed, modified, uploaded, downloaded, shared, or synced files are considered sites with file activity and are considered active sites. |
| 4 | The Files view shows the number of files across all sites and the number of active files. A file is considered active if it has been saved, synced, modified or shared within the specific time period. Note: A file activity can occur multiple times for a single file, but will count only as one active file. For example, you can save and sync the same file multiple times over a specified time period, but it will count only as one single active file and one single synced file in the data. |
| 5 | The Storage view shows the trend on the amount of storage you are using in OneDrive for Business. |
| 6 |
|
| 7 | You can filter the series you see on the chart by clicking on an item in the legend. For example, on the Files chart, click or tap Files. On the Sites chart, you can click or tap Total sites or Active sites. Or on the Storage chart, you can click Storage allocated or Storage consumed. Changing your selection doesn't change the information in the table. |
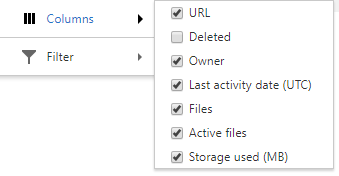
| 8 | The table shows you a breakdown of data at the per-OneDrive account level. All OneDrive accounts associated with an active user with a OneDrive product assigned to them will show up in this list. Users who are licensed but never active are not counted towards the data in the table. For the OneDrive account to be counted in the data, the user needs to have either logged in through the OneDrive sync client, or browsed to their OneDrive site through a web browser. If the OneDrive account has had file activity, it will have the latest date that the file activity was performed. The rows in the table are sorted by the Last activity date value and so the OneDrive accounts with the most recent file activity will show up at the top of the list. You can add or remove columns from the table. 
If your organization's policies prevent you from viewing reports where user information is identifiable, you can change the privacy setting for all these reports. Check out the How do I hide user level details? section in the Activity Reports in the Office 365 Admin Center Preview. |
| 9 | Click or tap the Manage columns icon |
| 10 | You can also export the report data into an Excel .csv file, by clicking or tapping the Export Note: When the data is exported to an Excel file, note that the date the content report was generated is reflected in the file in the Data as of column. |
 to add or remove columns from the report.
 link. This exports data of all sites and enables you to do simple sorting and filtering for further analysis. If you have less than 2000 sites, you can sort and filter within the table in the report itself. If you have more than 2000 sites, in order to filter and sort, you will need to export the data.
No comments:
Post a Comment