Important: In Excel for Microsoft 365 and Excel 2021, Power View is removed on October 12, 2021. As an alternative, you can use the interactive visual experience provided by Power BI Desktop, which you can download for free. You can also easily Import Excel workbooks into Power BI Desktop.
Information and tasks in this article refer to and use the sample AdventureWorksDWMultidimensional model as a data source. If you do not have the Adventure Works multidimensional model installed, you can still read through this article and get a good understanding of how Power View works with multidimensional models.
Prerequisites
To complete the tasks, you need:
Note: This feature does not apply to Power View in Excel 2013.
-
Microsoft SQL Server 2012 Analysis Services running in Multidimensional mode with Service Pack 1 Cumulative Update (CU) 4 applied or later.
-
Microsoft SQL Server 2012 Reporting Services in SharePoint Integrated mode with Service Pack 1 Cumulative Update (CU) 4 applied or later.
-
Microsoft SharePoint Server 2010 or 2013 Enterprise Edition or later is required. For SharePoint Server 2010, Service Pack 1 is recommended.
-
AdventureWorksDW2012 sample database is required as a data source for the Adventure Works Multidimensional Model.
-
Adventure Works Multidimensional Model for SQL Server 2012 deployed to the Analysis Services instance.
You should already know:
-
You should be familiar with how to create reports and design views in Power View. For detailed information and a Power View tutorial, see Power View: Explore, visualize, and present your data.
-
You should be familiar with how to create and save documents in a SharePoint library.
Use Power View to explore and analyze data in the AdventureWorksDW2012Multidimensional model
If you have the necessary prerequisites installed, you can complete the following tasks to create a shared data source connection to the AdventureWorksDWMultidimensional model, and then create a Power View report with different visualizations to explore Adventure Works data. Remember, you are creating a Power View report based on a multidimensional model exposed as a tabular model. Some objects and some behaviors may appear different from the traditional tabular models you may be familiar with. For more information, see Understanding Multidimensional Model Objects in Power View.
Sample report

Create a new Power View report
In this task, you will create a new Power View report using the Adventure Works Reseller Sales shared data source.
To create the Adventure Works Reseller Sales Power View report
-
In SharePoint, click the down arrow next to the Adventure Works Reseller Sales shared data source > Create Power View Report.
Power View opens in Edit mode with a blank view in the designer, the ribbon across the top, and the Field List on the right.
Create and explore dynamic views
Now that you have a blank view to work with, let's add some fields.
To add Country, State-Province, and City visualizations
1. Let's first add a title to our view. In the designer, click on Click here to add a title, and then type Adventure Works Reseller Sales.
2. In Field List, expand the Geography table.
Remember, Geography is a dimension in the AdventureWorksDWMultidimensional model, but because Power View works with tables, the Field List displays dimensions as tables.
Click and drag Country to the FIELDS area in the layout section. You will see a new Country visualization table in the view designer. If necessary, move the Country visualization to the upper left part of the view.
3. On the Design ribbon, click Slicer. The data in this visualization can now interact with other data fields you add to the view.
4. Click an empty space in the view to add a new visualization. From the Geography table, click and drag State-Province to the FIELDS area.
5. On the Design ribbon, click Slicer and then move the new State-Province visualization just below the Country visualization.
6. Click an empty space in the view to add a new visualization. From the Geography table, click and drag City to the FIELDS area. Make it a slicer and move it below the State-Province visualization.
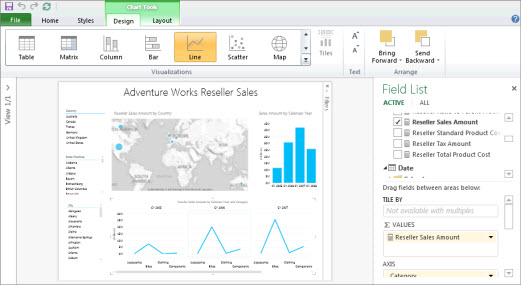
You should now have Country, State-Province, and City visualizations along the left side of the view. Align each of the visualizations so they match. Each of these visualizations will act as slice filters, allowing you to drill down reseller sales data by location.
To create the Reseller Sales Amount map visualization
1. Click an empty space in the view to add a new visualization. In Field List, expand the Reseller Sales measure table, and then click on the check box next to Reseller Sales Amount.
2. On the ribbon, in the Visualizations group, select Map.
Because you've changed the visualization to a map, the Reseller Sales Amount measure is automatically moved to the SIZE area in the layout section.
3. In the Field List, in the Geography table, click and drag Country, State-Province, and City, in that order, to the LOCATIONS area in the layout section. The globe icon for these fields, in the Field List, indicates these are geography attributes that can be used in a map visualization.
4. Resize and align the new Reseller Sales Amount map so it appears just below and about as wide as the title.
To create the Sales Amount by Calendar Year visualization
1. Click an empty space in the view to add a new visualization. In Field List, expand the Sales Summary measure table, and then click on the check box next to Sales Amount.
2. On the ribbon, in the Visualizations group, select Clustered.
Because you've changed the visualization to a Clustered Column, the Sales Amount measure is automatically moved to the VALUES area in the layout section.
3. In Field List, in the Date table, click and drag Calendar Year to the AXIS area in the layout section.
4. Resize and align the Sales Amount by Calendar Year visualization to the right of the Reseller Sales Amount by Country map visualization.
To create the Reseller Sales Amount by Calendar Year, and Category field
1. Click an empty space in the view to add a new visualization. In Field List, expand the Reseller Sales measure table, click on the check box next to Reseller Sales Amount.
2. On the ribbon, in the Visualizations group, select Line.
Because you've changed the visualization to a Line, the Reseller Sales Amount measure is automatically moved to the VALUES area in the layout section.
3. In Field List, in the Date table, click and drag Calendar Year to the HORIZONTAL MULTIPLES area in the layout section.
4. In Field List, in the Product table, click and drag Category, Subcategory, and Product, in that order, to the AXIS area in the layout section.
5. Resize and align the new visualization below the Reseller Sales Amount by Country map and Sales Amount by Calendar Year visualization.
Your view should now appear like this:

6. Save your new Power View report as Adventure Works Reseller Sales.
Now that you have a view with a number of different fields, take some time to explore and visualize the AdventureWorksDWMultidimensional model data.
Note: Power View displays visual totals only. Multidimensional models support queries for grand totals or visual totals depending on dimension security settings. In Power View, totals are restricted to only those values defined by the filter context as well those defined in dimension security.

No comments:
Post a Comment