Create a chart
Use the Quick Analysis tool to pick the right chart for your data.
-
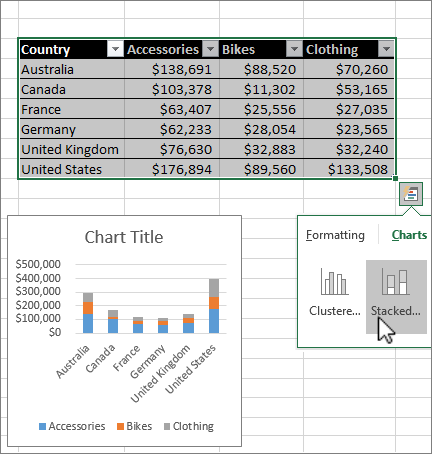
Select the data you want to show in a chart.
-
Select the Quick Analysis button
 to the bottom-right of the selected cells.
 -
Select Charts, hover over the options, and pick the chart you want.
Try it! Select File > New, select Take a tour, and then select the Chart Tab. For more information, see Create charts.
Use conditional formatting
Use Quick Analysis to highlight important data or show data trends.
-
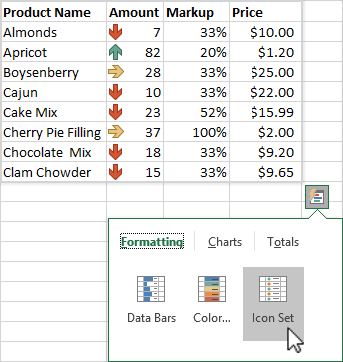
Select the data to conditionally format.
-
Select the Quick Analysis button
to the bottom-right of the selected cells. -
Select Formatting, hover over the options, and pick the one you want.
Try it! Select File > New, select Take a tour, and then select the Analyze Tab.
No comments:
Post a Comment