Office 365 Reports in the Admin Center - Microsoft Office activations
The new Office 365 Reports dashboard shows you the activity overview across the Office 365 products in your organization. It enables you to drill in to individual product level reports to give you more granular insight about the activities within each product. Check out the Reports overview topic.
The Office Activation report gives you a view of which users have activated their Office subscription on at least one device. It provides a breakdown of the Office 365 Proplus, Project, and Visio Pro for Office 365 subscription activations, as well as the breakdown of activations across desktop and devices. This report could be useful in helping you identify users that might need additional help and support to activate their Office subscription.
Note: You must be a global administrator in Office 365 or an Exchange, SharePoint, Skype for Business administrator, or reports reader to see Office 365 reports.
How to get to the Office activations report
-
Go to the Office 365 admin center > Reports
-
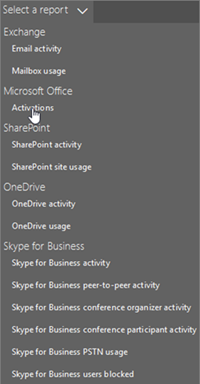
Click on the Activations widget on the Reports dashboard or select from the drop down.

Interpret the Office activations report
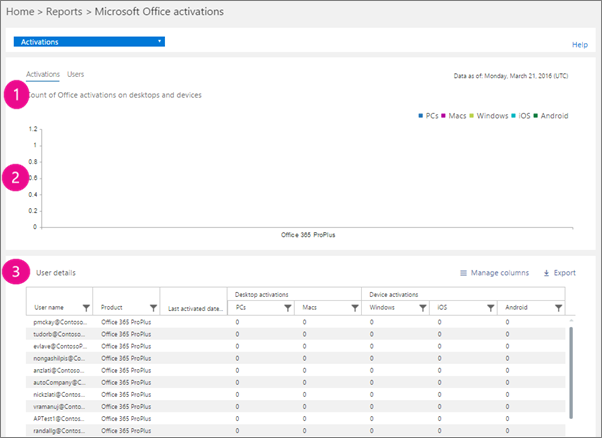
You can get a view into your organization's Office activations by looking at the Activations and Users charts.

| 1 | The Office Activations report presents the current state of the office license activations data [as of the date of the report presented on the top right of the chart]. |
| 2 | Each report has a date for when this report was generated. The reports usually reflect a 24 to 48 hour latency from time of activity. |
| 3 | The Activations chart shows you the count of Office activations on desktops and devices. |
| 4 | The Users chart shows you the count of users that are enabled, and users that have activated the Office subscription on desktop or devices.. |
| 5 |
|
| 6 | You can filter charts you see by clicking on an item in the legend. For example, on the Activations chart, click or tap Windows OS, Mac OS, Windows 10 mobile, iOS or Android |
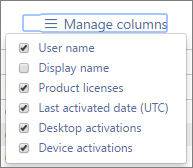
| 7 | The table shows you a breakdown of Office activations at the user level. This is the list of all user's with the Office product assigned to them. You can add the additional columns to the table. 
If your organization's policies prevents you from viewing reports where user information is identifiable, you can change the privacy setting for all these reports. Check out the Hide user details in the reports section in the Activity Reports in the Office 365 Admin Center. |
 to see only the info related to each one. Changing this selection doesn't change the info in the grid table.
No comments:
Post a Comment