How to use data bars
In Visio Professional, a data bar is a data graphic that can be applied after you import data to shapes. The following example shows a data bar for the % Complete field for each of these three shapes:

Data bars are good for showing percentages, ratings, progresses, scores, and amounts.
Applying the data bar to shapes
-
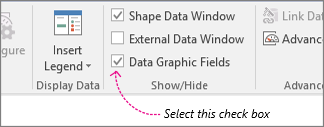
Make sure the Data Graphic Fields pane is open on the right. If it isn't open, on the Data tab, click to select the Data Graphic Fields check box.
-
Do one of the following:
-
If you want to change all shapes on the page, click an empty space on the diagram to deselect any shapes that may be selected.
-
If you want to change only select shapes on the page, click one or more shapes to select them.
-
-
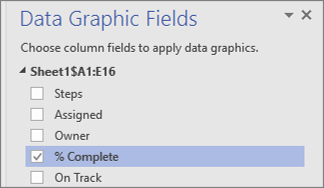
In the Data Graphic Fields pane, identify which field of data you want to change to a data bar.
-
In the same pane, make sure the field you want to change has a check mark, and make sure to select it so that it is highlighted in blue:
-
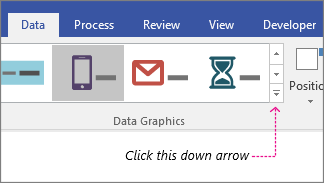
On the Data tab, click the down arrow at the bottom of the Data Graphic gallery.
-
Then choose an item under Data Bar.
Configuring other data bar properties
After applying a data bar, you may need to configure it so that the graphic visualizes your data properly. For example, you might want to change properties like text formatting, or you may want to position it differently.
-
Do steps 1-4 above.
-
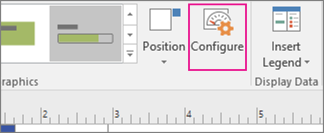
On the Data tab, click Configure.
-
If you want to change the overall look of the data bar, choose another style from the Style menu.
-
To change how the data bar "fills" or shows progress, you can set the minimum and maximum values:
-
Minimum value This is the value that will cause the data bar to appear "empty." If your data is in percentage format, the minimum value is set to 0, and therefore the data bar will look empty with that value. But if your data isn't in percentage format, you can set the minimum to another value. For example, let's say that across the data, the bottommost of the values is 15. You could set the minimum value to 15, and then the data bar won't show any completion until the value is greater than 15.
-
Maximum value This is the value that will cause the data bar to appear "full." If your data is in percentage format, the maximum value is set to 100, and therefore the data bar will look "filled" at 100. But if your data isn't in percentage format, you can set the maximum to another value. For example, let's say that across the data, the uppermost value is 150. You could set the maximum value to 150, and then the data bar won't get completely filled until the value is at 150.
-
-
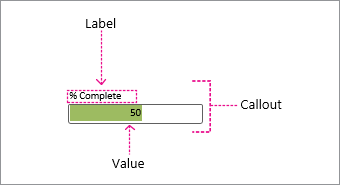
You can also change the label, value, and callouts. The following illustration identifies each of these components. The label is the field name (or, column name) of the imported data. The value is the actual value of the field. The callout is the entire region of the data graphic.
-
Label Position Determines the position of the field name relative to the data bar. There are several options: Top, Bottom, Left, and Right are the common ones. There is even a Not Shown option if you don't want to display it. In the example above, the Label Position is set to Top.
-
Label This is the actual text of the field name. If you want to customize this from the default field name that resides in your data, you can select [Default], press DELETE, and then type your own text. For example, you could change it to "% Done."
-
Label Font Size This sets the font size of the label.
-
Value position This property determines where the value of the data is displayed relative to the data bar. There are several options: Interior, Top, Bottom, Left, and Right and so on. There is even a Not Shown option if you don't want to display the value. In the above example, the value position is set to Interior.
-
Value Format This property lets you set the data format of the value. Click the "…" button, and then choose from popular formats like Number, Currency, Date/Time, and so on.
-
Value Font Size This sets the font size of the value.
-
Callout Offset This lets you nudge the position of the overall callout to the left or to the right.
-
Callout Width This lets you change the width of the overall region of the data graphic. If you specify a number, the default unit is inches. For example, if you type 2, the width of the data graphic region changes to 2 inches. You can also specify the width in points. If you specify in points, make sure to use a number, space, and then "pt." For example: 100 pt.
-
-
You can also reposition your data graphics.
No comments:
Post a Comment