With Project, you can create and customize striking graphical reports of whatever project data you want, without having to rely on any other software. As you work on the project, the reports change to reflect the latest info — no manual updates required! See a list of all reports and how you can use them.
-
Click the Report tab.
-
In the View Reports group, click the type of report you want and then pick a specific report.
For example, to open the Project Overview report, click Report > Dashboards > Project Overview.
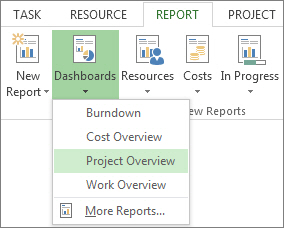
The Project Overview report combines graphs and tables to show where each phase of the project stands, upcoming milestones, and tasks that are past their due dates.

Project provides dozens of reports you can use right away, but you don't have to let that limit your choices. You can customize the content and the look of any of the reports, or build a new one from scratch.
Work with your report
Change the data in a report
You can choose the data that Project shows in any part of a report.
-
Click the table or chart you want to change.
-
Use the Field list pane on the right of the screen to pick fields to show and filter information.
Tip: When you click a chart, three buttons also pop up directly to the right of the chart. Use the Chart Elements  and Chart Filters
  buttons to quickly pick elements such as data labels and filter the information that goes into the chart.
Example
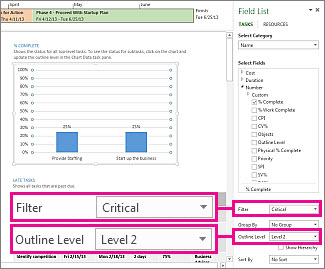
In the Project Overview report, you could change the % Complete chart to show critical subtasks instead of top-level summary tasks:
-
Click anywhere in the % Complete chart.
-
In the Field List pane, go to the Filter box and pick Critical.
-
In the Outline Level box, pick Level 2. For this example, this is the first level of the outline that has subtasks instead of summary tasks.
The chart changes as you make your selections.
Change how a report looks
With Project, you control the look of your reports, from no-nonsense black and white to explosions of colors and effects.
Tip: You can make a report part of a split view so you can see the report change in real time as you work on project data. To learn more, see Split a view.
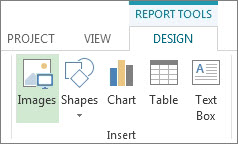
Click anywhere in the report and then click Report Tools Design to see the options for changing the look of the whole report. From this tab, you can change the font, color, or theme of the whole report. You can also add new images (including photos), shapes, charts, or tables here.
When you click individual elements (charts, tables, and so on) of a report, new tabs appear at the top of the screen with options for formatting that part.

-
Drawing Tools Format tab. Format shapes and text boxes.
-
Picture Tools Format tab. Add effects to pictures.
-
Table Tools Design and Table Tools Layout tabs. Configure and tweak tables, like you would in other Office programs.
-
Chart Tools Design and Chart Tools Format tabs. Configure and tweak charts.
Tip: When you click a chart, three buttons also pop up directly to the right of the chart. Click the Chart Styles button  to quickly change the color or style of a chart.
Example
Say you decide that the % Complete chart in the Project Overview report needs a facelift.

-
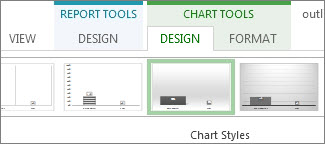
Click anywhere in the % Complete chart, and then click Chart Tools Design.
-
Pick a new style from the Chart Styles group. This style removes the lines and adds shadows to the columns.
-
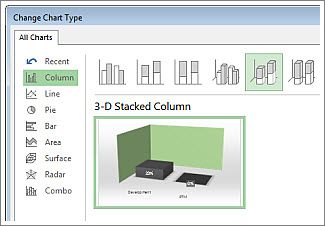
Give the chart some depth. Click Chart Tools Design > Change Chart Type.

-
Click Column > 3-D Stacked Column.
-
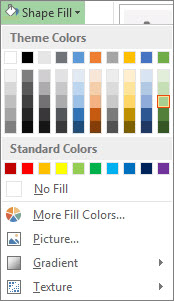
Add a background color. Click Chart Tools Format > Shape Fill, and pick a new color.
-
Change the bar colors. Click the bars to select them, then click Chart Tools Format > Shape Fill, and pick a new color.
-
Move the numbers off the bars. Click the numbers to select them, and then drag them upward.
Just a few clicks make a big difference. And we only scratched the surface of the formatting options.

Make your own report
-
Click Report > New Report.
-
Pick one of the four options, and then click Select.
-
Give your report a name and start adding information to it.
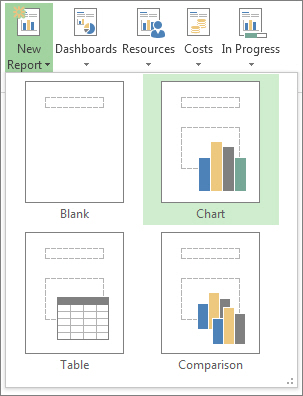
Blank Creates a blank canvas. Use the Report Tools Design tab to add charts, tables, text, and images.
Chart Project creates a chart comparing Actual Work, Remaining Work, and Work by default. Use the Field List pane to pick different fields to compare, and use the controls to change the color and format of the chart.
Table Use the Field List pane to choose what fields to display in the table (Name, Start, Finish, and % Complete appear by default). The Outline level box lets you select how many levels in the project outline the table should show. You can change the look of the table on the Table Tools Design and Table Tools Layout tabs.
Comparison Sets two charts side-by-side. The charts have the same data at first. Click one chart and pick the data you want in the Field List pane to begin differentiating them.
Any of the charts you create from scratch are fully customizable. You can add and delete elements and change the data to meet your needs.
Share a report
-
Click anywhere in the report.
-
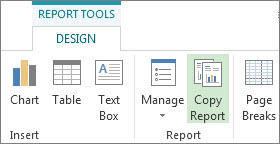
Click Report Tools Design > Copy Report.
-
Paste the report into any program that displays graphics.
Tip: You might need to resize and line up the report when you paste it into its new home.
You can also print the report to share it the old-fashioned way.
Make a new report available for future projects
Use the Organizer to copy a new report into the global template for use in future projects.
More ways to report project info
-
See a list of all reports and how you can use them.
-
Compare actual work against your estimates with burndown reports.
-
Create a timeline of key tasks and milestones.
-
Set the status date for project reporting.
Visual reports allow you to view Project information graphically using enhanced PivotTables in Excel 2010. Once Project information has been exported to Excel, you can customize the reports further with Excel 2010 enhanced PivotTable features, such as filter slicers, searching within PivotTables, sparklines within PivotTables to show trends instantly, and OLAP write-back improvements.
Available visual reports
The report templates in Project 2010 are divided into six categories in the Visual Reports - Create Report dialog box, which you can access by clicking Visual Reports in the Reports group of the Project tab. The following sections provide descriptions of the visual reports in each category.
You can also create your own custom reports. Custom reports will appear in the category for the type of data used.
Task Usage category
The following table describes the visual reports in the Task Usage category. These reports are based on timephased task data.
Note: Timephased assignment data is available in reports in the Assignment Usage category.
| Name | Type | Description |
|---|---|---|
| Cash Flow Report | Excel | Use this report to view a bar graph with cost and cumulative cost amounts illustrated over time. |
| Earned Value Over Time Report | Excel | Use this report to view a chart that plots AC (actual cost of work performed), planned value (budgeted cost of work scheduled), and earned value (budgeted cost of work performed) over time. |
Resource Usage category
The following table describes the visual reports in the Resource Usage category. These reports are based on the timephased resource data.
Note: Timephased assignment data is available in reports in the Assignment Usage category.
| Name | Type | Description |
|---|---|---|
| Cash Flow Report | Visio | Use this report to view a diagram that shows planned and actual costs for your project over time. Costs are broken down by resource type (work, material, and cost). An indicator shows if planned costs exceed baseline costs. |
| Resource Availability Report | Visio | Use this report to view a diagram that shows the work and remaining availability for your project's resources, broken down by resource type (work, material, and cost). A red flag is displayed next to each resource that is overallocated. |
| Resource Cost Summary Report | Excel | Use this report to view a pie chart that illustrates the division of resource cost between the three resource types: cost, material, and work. |
| Resource Work Availability Report | Excel | Use this report to view a bar graph with total capacity, work, and remaining availability for work resources illustrated over time. |
| Resource Work Summary Report | Excel | Use this report to view a bar graph with total resource capacity, work, remaining availability, and actual work illustrated in work units. |
Assignment Usage category
The following table describes the visual reports in the Assignment Usage category. These reports are based on the timephased data, similar to the data found in the Task Usage and Resource Usage views.
| Name | Type | Description |
|---|---|---|
| Baseline Cost Report | Excel | Use this report to view a bar graph with baseline cost, planned cost, and actual cost for your project illustrated across tasks. |
| Baseline Report | Visio | Use this report to view a diagram of your project broken down by quarter, then by task. This report compares planned work and cost to baseline work and cost. Indicators are used to show when planned work exceeds baseline work, and when planned cost exceeds baseline cost. |
| Baseline Work Report | Excel | Use this report to view a bar graph with baseline work, planned work, and actual work for your project illustrated across tasks. |
| Budget Cost Report | Excel | Use this report to view a bar graph with budget cost, baseline cost, planned cost, and actual cost illustrated over time. |
| Budget Work Report | Excel | Use this report to view a bar graph with budget work, baseline work, planned work, and actual work illustrated over time. |
| Earned Value Over Time Report | Excel | Use this report to view a chart that plots AC (actual cost of work performed), planned value (budgeted cost of work scheduled), and earned value (budgeted cost of work performed) over time. |
Task, Resource, and Assignment Summary categories
The following table describes the visual reports in the Task Summary, Resource Summary, and Assignment Summary categories. Summary reports do not include timephased data.
| Category | Name | Type | Description |
|---|---|---|---|
| Task Summary | Critical Tasks Status Report | Visio | Use this report to view a diagram showing the work and remaining work for both critical and non-critical tasks. The data bar indicates the percent of work complete. |
| Task Summary | Task Status Report | Visio | Use this report to view a diagram of the work and percent of work complete for tasks in your project, with symbols indicating when baseline work exceeds work, when baseline work equals work, and when work exceeds baseline work. The data bar indicates the percent of work complete. |
| Resource Summary | Resource Remaining Work Report | Excel | Use this report to view a bar graph with remaining work and actual work for each work resource, illustrated in work units. |
| Assignment Summary | Resource Status Report | Visio | Use this report to view a diagram of the work and cost values for each of your project's resources. The percent of work complete is indicated by the shading in each of the boxes on the diagram. The shading gets darker as the resource nears completion of the assigned work. |
Create a visual report by using a template
-
On the Project tab, in the Reports group, click Visual Reports.
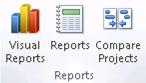
-
In the Visual Reports dialog box, on the All tab, click the report that you want to create.
If the report that you want to create is not listed, select the Include report templates from check box, and then click Modify to browse to the location that contains your report.
Tip: If you know which category contains the report, you can click that category's tab to view a shorter list of reports. If you only want to list reports that open in either Excel or Visio, select or clear the Microsoft Excel or Microsoft Visio check box.
-
To change the level of usage data included in the report, select Years, Quarters, Months, Weeks, or Days from the Select level of usage data to include in the report list.
Note: By default, Project sets the level of usage data to what it recommends for your project's size. For most projects, this will be weeks. If you choose to include data at a more detailed level, report performance may be decreased. For best performance, if you are viewing multiple reports for the same project at one time, refrain from changing the data level. If you change the data level, the temporary reporting database stored locally must be recreated. If you don't need to include usage data in your reports, set the data level to Years for best performance.
-
Click View to generate the report and open it in Excel or Visio.
Edit an existing visual report template
-
On the Project tab, in the Reports group, click Visual Reports.
-
In the Visual Reports dialog box, on the All tab, click the report that you want to edit.
Tip: If you know which category contains the report, you can click that category's tab to view a shorter list of reports. If you only want to list reports that open in either Excel or Visio, select or clear the Microsoft Excel or Microsoft Visio check boxes.
-
Click Edit Template.
-
On the Visual Reports - Field Picker dialog box, click the fields that you want to add or remove from the report, and then click Add, Remove, or Remove All to move fields between the Available Fields and Selected Fields boxes, or between the Available Custom Fields and Selected Custom Fields boxes.
Fields in the Selected Fields and Selected Custom Fields boxes are included in the report.
-
Click Edit Template to create the report with the modified list of fields.
-
On the Visual Reports - Field Picker dialog box, some fields are identified as dimensions. It is important to select fewer than six dimensions for your report. If you select more than six dimensions, report performance is significantly decreased.
-
Not all fields are available in all reports. Some fields are only available in Visio reports, but not in Excel reports.
-
If you are unable to locate the field you want to include on the Visual Reports - Field Picker dialog box, it may be stored in a different category of data. For example, many fields that you might think of as Task Summary fields are actually Assignment Summary fields.
Create a new visual report template
-
On the Project tab, in the Reports group, click Visual Reports.
-
In the Visual Reports dialog box, click New Template.
-
In the Select Application section, click Excel to create an Excel template, or click Visio (Metric) to create a Visio template.
-
In the Select Data Type section, select the type of data that you want to use in the report.
To include timephased data, select Task Usage, Resource Usage, or Assignment Usage from the list in the Select Data Type section.
-
Click Field Picker.
-
On the Visual Reports - Field Picker dialog box, hold CTRL and click the default Project fields that you want to add to the report in the Available Fields box.
-
Click Add to move them to the Selected Fields box.
-
Hold CTRL and click the custom fields that you want to add to the report in the Available Custom Fields box.
-
Click Add to move them to the Selected Custom Fields box.
-
If you have the English version of Office Project 2007 installed, you have the option to create a Visio template that uses U.S. units.
-
To remove a field from the report, on the Visual Reports - Field Picker dialog box, click the field in the Selected Fields or Selected Custom Fields box, and then click Remove. To remove all default or custom fields from the report, click Remove All in the Select Fields or Select Custom Fields section.
-
Not all fields are available in all reports. Some fields are only available in Visio reports, and not in Excel reports.
-
If you are unable to locate the field you want to include on the Visual Reports - Field Picker dialog box, it may be stored in a different category of data. For example, many fields that you might think of as Task Summary fields are actually Assignment Summary fields.
-
On the Visual Reports - Field Picker dialog box, some fields are identified as dimensions. It is important to select fewer than six dimensions for your report. If you select more than six dimensions, report performance is significantly decreased.
-
When you have finished creating your visual report, you can choose to save it to the default template location (c:\Program Files\Microsoft Office\Templates) or to another location on your computer or your network. Templates saved in the default template location automatically appear on the Visual Reports - Create Report dialog box.
-
If you begin using a different language pack after saving a custom visual report template, the template remains available but is not populated. The original field names are not recognized in the new language and are not included in the report.
Export report data
You can select specific data to export within a category (OLAP cube), or you can export all project data as a reporting database.
Export data as an OLAP cube
-
On the Project tab, in the Reports group, click Visual Reports.
-
In the Visual Reports dialog box, click Save Data.
-
In the Save Reporting Cube section, select the category that contains the type of data that you want to save.
-
Click Field Picker to modify the fields included in the list of data to export.
-
On the Visual Reports - Field Picker dialog box, click the fields that you want to add or remove from the list of data to export, and then click Add, Remove, or Remove All to move fields between the Available Fields and Selected Fields boxes, or between the Available Custom Fields and Selected Custom Fields boxes.
Fields in the Selected Fields and Selected Custom Fields boxes are included in the exported data.
-
Click OK on the Visual Reports - Field Picker dialog box, and then click Save Cube.
-
Browse to the location where you want to save the cube data, and then click Save.
-
Cube data is saved as a .cub file.
-
When accessing cube data with Visio, the .cub file cannot be stored on a network share.
Export data as a reporting database
-
On the Project tab, in the Reports group, click Visual Reports.
-
In the Visual Reports dialog box, click Save Data.
-
Click Save Database.
-
Browse to the location where you want to save the database, and then click Save.
The data is saved as a Microsoft Office Access database (.mdb) file.
Project for the web offers two main options for reporting: Excel and Power BI Desktop. Excel reporting comes with Microsoft 365, while Power BI Desktop is licensed separately.
Excel
When managing a project in Project for the web, export your project to Excel allows you to:
-
Create reports and visuals
-
Send a file containing project details to external stakeholders
-
Archive copies of your project data for audit and compliance
-
Print copies of your project
Here's how to export your project:
-
Go to project.microsoft.com and open the project you want to export to Excel.
-
In the top right corner, select the three dots (...), then select Export to Excel.
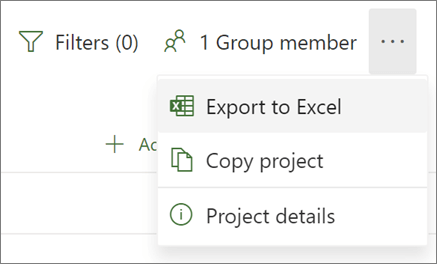
-
When you see the message "All done! We've exported [your project name]." at the bottom of the screen, you can look for your new Excel file where you store your downloads.
When you open the Excel file containing your project, you'll see a worksheet named "Project tasks" that contains a summary of project-wide information at the top, including its name, project manager, and the start and finish dates, duration, and percent complete for the whole project. You'll also see what date it was exported. Under that, you'll see a table of all the information for your project.
More about Excel Report options
Power BI Desktop
To get started, connect to Project for the web data through Power BI Desktop, then open the Project Power BI template and explore the reports it includes.
Important: You'll need a Power BI subscription (and a Project subscription in many cases) to use this reporting tool. See the following section for details.
Licensing
To use Power BI reports on Project for the web data, you need to be a licensed user of Power BI Desktop or Power BI Pro. See Power BI Pricing for more information.
To build or customize Power BI reports on Project for the web data, you'll also need Project Plan 3 (formerly Project Online Professional) or Project Plan 5 (formerly Project Online Premium).
Microsoft Office Tutorials: Create A Project Report In Project Desktop >>>>> Download Now
ReplyDelete>>>>> Download Full
Microsoft Office Tutorials: Create A Project Report In Project Desktop >>>>> Download LINK
>>>>> Download Now
Microsoft Office Tutorials: Create A Project Report In Project Desktop >>>>> Download Full
>>>>> Download LINK Ot