With the Charts and Graphs template you can create a simple pie chart or a pie chart that emphasizes particular slices.
In this article
Create a simple pie chart
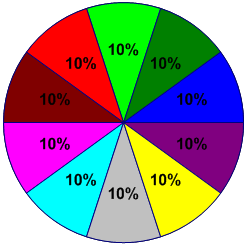
The Pie chart shape initially has 10 brightly colored slices of equal size. You can adjust the number, size, and color of each slice. The following illustration shows a pie chart in which we have changed the number and size of the slices while keeping the original colors.

-
On the File menu, click New. Select Categories then select Business. Then click Charts and Graphs or Marketing Charts and Diagrams.
-
From the Charting Shapes stencil, drag the Pie chart shape onto the drawing page, and then select the number of slices that you want.
Tip: To change the number of slices later, right-click the pie chart, click Set Number of Slices, and then select a different number of slices.
-
Set the size of each slice in terms of its percentage of the pie:
-
Right-click the Pie chart shape, and then click Set Slice Sizes.
-
Type the size that you want for each slice, and then click OK.
Tip: In the Shape Data dialog box, Pie 1 corresponds to the dark blue slice on your drawing page, Pie 2 corresponds to the slice to the left of Pie 1, and so on. The Shape Data dialog box is accessed by right-clicking the Pie Chart, selecting Data, then selecting Shape Data.
-
-
To change the color of a pie slice, select the pie chart, and then click an individual slice to select it. Click the arrow on the Fill button
 , and then click the color you want.
 -
To add a title to the chart, from the Charting Shapes stencil, drag a Text block shape onto the drawing page. While the shape is selected, type a title.
Create a pie chart with an emphasized slice
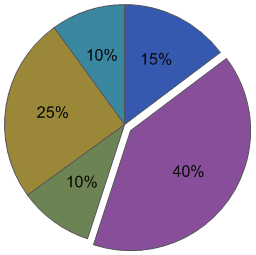
To create a pie chart with an emphasized slice, use as many Pie slice shapes as your chart requires. The following illustration shows a pie chart with an emphasized slice. The pie chart is colored by applying a theme.

-
On the File menu, click New. Select Categories, then select Business. Then click Charts and Graphs or Marketing Charts and Diagrams.
-
From Charting Shapes, drag the Pie slice shape onto the drawing page.
-
Drag a second Pie slice shape and place it near the first slice.
-
Drag the endpoint at the center of the second slice to the connection point at the bottom left corner of the first slice.
-
To change the percentage of a Pie slice shape, select it, and then drag its control handle until the slice is the size you want.
-
Repeat steps 3 through 5 to create the rest of the slices, moving counterclockwise around the pie.
-
In Visio 2016 and newer versions, click the View tab, and then click the dialog launcher in the Visual Aids group. Make sure the Snap check box is selected, clear the Glue check box, and then click OK.
-
Select each pie slice, move it slightly to break the glue (the endpoints change from red to green), and then snap it back into place.
-
Drag the slice that you want to emphasize away from the other slices.
Tip: You can right-click a pie slice and then choose Add 1% to increase the size of the slice by 1%. Choose Reset to return the slice to its original size.
No comments:
Post a Comment