Customize Data Views and forms using SharePoint Designer
A Data View is a live, customizable view of a data source from a SharePoint site. SharePoint Designer 2010 retrieves data from a data source in the form of Extensible Markup Language (XML) and displays or provides data input using Extensible Stylesheet Language Transformations (XSLTs). The Data View can display data from a wide variety of sources, including SharePoint lists and libraries, database queries, XML documents, Web services, and server-side scripts. You add and customize Data Views using SharePoint Designer 2010.
SharePoint Designer 2010 includes a rich set of tools that you can use to customize list and Data Views as shown here.

The WYSIWYG tools in SharePoint Designer 2010 insert Extensible Stylesheet Language (XSL) directly into the page so that you don't have to know XSL to create powerful customized Data Views. If you need to customize the code, you can always edit the XSL directly in Code view in SharePoint Designer 2010.
There are a number of ways you can create views and forms in SharePoint Designer 2010. You can create a list view associated with a SharePoint list or library; you can create a Data View and associate it with the same list or another data source; you can create a form by adding a Data View to your page then inserting each field as a form; and so on. Learn more about creating views and forms in the See Also section.
These result in a combination of List Views (XSLT List View Web Part) and Data Views (Data Form Web Part) on your pages, and while there are differences between the two, you customize them in similar ways. You add and remove columns, apply filters, sort and group fields, apply conditional formatting, and much more using the tools available in SharePoint Designer 2010.
This article describes the most common customizations you'll make to list or Data Views using SharePoint Designer 2010.
In this article
Opening List and Data Views
List Views and Data Views can be created and opened in a number of ways in SharePoint Designer 2010 (as explained in the beginning of this article). You can, for example, open a List View from the list or library it is currently associated with, or you can open a Data View from the site page where it is located. Both options are on the Navigation menu. (Associated with a list or library, or any number of data sources. Use one of the methods below to open a List View or Data View in SharePoint Designer 2010.)
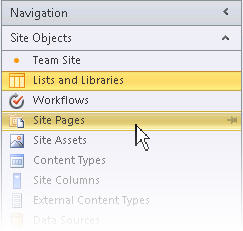
To open a List View associated with a list
-
Open your site in SharePoint Designer 2010.
-
In the Navigation pane, click Lists and Libraries.
-
Open the list that contains your list view.
-
Click the Options tab and use the view editing options to customize the List View.
Note: You may need to first click inside the view in order to display the view editing options in SharePoint Designer 2010
To open a Data View or List View from a site page
-
Open your site in SharePoint Designer 2010.
-
In the Navigation pane, click Site Pages.
-
Open the page that contains your Data View or List View.
-
Click the Options tab and use the view editing options to customize the List or Data View.
Note: You may need to first click inside the view in order to display the view editing options in SharePoint Designer 2010.
The rest of this article assumes you have performed these steps or similar steps to open your view for editing.
Add, remove, and rearrange columns
One of the first things you typically do with a Data View is add and remove columns. When you change the columns in a Data View, you're adding, removing, or arranging the fields as they appear in the Data View. You use the Edit Columns dialog box to add, remove, and reorder columns, whether they display rows or columns. You can also modify columns using the table editing commands on the Table tab. Table layout is discussed later in this article.
Note: The Edit Columns command is available only when the Data View displays data in an HTML table.
Perform the following steps to add, remove, and rearrange columns in a List or Data View.
-
With your view open in SharePoint Designer 2010, click the Options tab and then click Add/Remove Columns
 .
.Note: The Edit Columns command is not available if the Data View is in an HTML table that uses rowspan or colspan attributes with a value greater than 1.
-
The Edit Columns dialog box opens.

-
Perform one of the following:
-
To add a column, select the column field under Available fields and then click Add.
-
To select multiple fields at one time, press and hold CTRL while you click the fields.
-
To remove an existing column, select the column under Displayed Columns and then click Remove.
-
To select multiple fields at one time, press and hold CTRL while you click the fields
-
To rearrange columns, select the column under Displayed Columns and then click Move Up or Move Down
-
-
Click OK to apply your changes to the view.
Note: The Edit Columns dialog box will show only the fields that are included in the data source query of the data view. Your actual data source may contain additional fields. To include those fields, you need to update the data source query.
Learn more about Data Views in the See Also section.
Sort and group
When you sort data in a Data View, you modify the order in which the data appears so that it's easier for you and your site visitors to understand the data. Examples of sort order include alphabetical and numerical ordering. You can create additional sort orders using the Advanced Sort dialog box in SharePoint Designer 2010.
In addition to sorting, you can group data. When grouping data, you can display a header or footer for a group of fields in the sort order and choose whether the group is expanded or collapsed by default. You can also choose to keep groups together when paging through the view and show the column names or totals for each group.
To sort columns in a List or Data View
With your view open in SharePoint Designer 2010, click the Options tab and then click Sort & Group  .
.
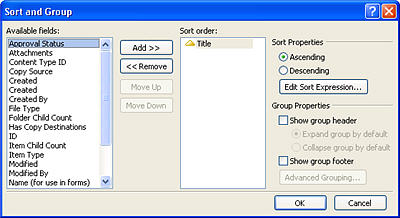
The Sort and Group dialog box opens.
-
Under Available fields, click the field that you want to sort on, and then click Add.
-
Under Sort Properties, choose how you want to sort the fields by selecting Ascending (lowest to highest) or Descending (highest to lowest).
You can also change the ascending or descending sort order by simply double-clicking the field in the Sort order list.
-
To use more advanced sorting than ascending or descending, click Edit Sort Expression. This opens the Advanced Sort dialog box where you can customize the sort order using XPath expressions. Learn more in Advanced List and Data View customizing using XPath expressions.
-
To sort on multiple fields, choose more fields under Available fields and then add them to the sort order.
If you add multiple fields to the sort order and want to change which field is sorted first, select the field in the Sort order list and click Move Up or Move Down.
Click OK to apply your changes to the view.
To group columns in a List or Data View
With your view open in SharePoint Designer 2010, click the Options tab and then click Sort & Group  .
.
-
The Sort and Group dialog box opens.

-
In the Sort order list, click the field that you want to group by.
Note each field in the sort order can have individual group properties applied to it. Make sure that you select the field that you want before you apply the group properties. -
To show a header at the beginning of each group, under Group Properties, select the Show group header check box, and then do one of the following:
-
To have groups in the view appear as expanded by default, click the Expand group by default.
-
To have groups in the Data View appear as collapsed by default, click Collapse group by default
-
-
The remaining options only apply to Data Views and not list views. (For more information on list and Data View differences, visit the See Also section.)
-
To show a footer at the end of each group that displays how many records are in that group, select the Show group footer check box.
-
After you select either the Show group header or Show group footer check box, the Advanced Grouping button becomes available.
-
Click Advanced Grouping. (This option becomes enabled when you check the Show group header or Show group footer option).
-
Perform one of the following:
-
To hide the individual records in the list, select the Always hide group details check box.
-
To show all items in a group on one page, even if the total exceeds the specified number of items to display in a list, select the Maintain groups when paging check box.
-
To insert a row in each group that displays the column names, select the Show column names per group check box.
-
To insert a row in each group that displays the total number of records within each group, select the Show column totals per group check box.
-
To allow site users to sort or group data through the browser, you can add a toolbar to the view as described later in this article.
Filter
You can apply a filter to your view so that only the data that satisfies a certain criteria will appear in the list or Data View. This is useful when you have a view that contains hundreds or thousands of records and you want to make it easier to read the data. When creating a filter, you build one or more expressions that are applied to the data. There are three basic parts: the field name (the name of the field on which you want to filter), the operator (the rule that you want to apply to the value), and the value (the data that you are looking for).
Perform the following steps to filter a List or Data View.
-
With your view open in SharePoint Designer 2010, click the Options tab and then click Filter
 .
. -
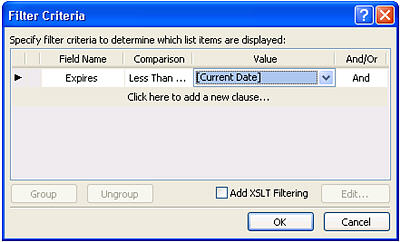
The Filter Criteria dialog box opens.
-
Under Field Name, click the field that contains the values that you want.
-
Click the Comparison box, and then click the operator that you want.
-
Click the Value box, and then select or type the criteria that you want.
-
To add another clause to the filter, click the And/Or box at the end of the existing clause, and then:
-
Click And to create a filter where the data must match the criteria in both clauses.
-
Click Or to create a filter where the data must match the criteria in only one clause.
-
-
Click on the message Click here to add a new clause.
-
Repeat steps 3-6 to create an additional clause for this filter.
-
If you're working Data Views and want to use more advanced conditions, check the Add XSLT Filtering box and then click Edit.
This opens the Advanced Condition dialog box where you can customize the sort order using XPath expressions. -
Click OK.
To allow site visitors to sort and group data through the browser, you can add a toolbar to the view as described later in this article. Just keep in mind that filtering in the browser affects only the presentation of the data; it doesn't limit the amount of data that is available in the view.
Note: Filtering a Data View can have performance implications. It's important to filter a manageable set of data. When you apply basic filtering using the Filter Criteria dialog box, the filter is applied before the data is returned. If however, you use the Advanced Filtering option (available to Data Views); the filtering is applied in the XSLT presentation, after the data is returned
Conditional formatting
With conditional formatting, you can apply formatted text, background colors, custom icons, and more to a selected HTML tag or data value when the data meets a certain criteria. You can also set conditions that determine whether to show or hide an HTML tag or data value. Conditional formatting is a powerful way to highlight items in a data view that require action by the user. You might, for example, highlight tasks that are past due, projects that are running over budget, or company supplies that are running low.
Perform the following steps to apply conditional formatting to a List or Data View.
With your view open in SharePoint Designer 2010, click in the row or column where you want to apply conditional formatting.
-
Click the Options tab, click Filter
 , and choose one of the following:
 -
Show Content to display data in the view that meet specified criteria.
-
Hide Content to hide data in the view that meet specified criteria.
-
Format Row to apply formatting to a row that meets specified criteria.
-
Format Column to apply formatting to a column that meets specified criteria.
-
Format Selection to apply formatting to a selection that meets specified criteria. (You must first highlight a portion of the data view before using this option.)
The Show and Hide content options change the visibility of selected HTML tags or data values. The Format options apply a style to selected HTML tags or data values.
-
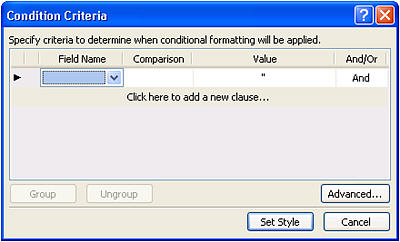
The Condition Criteria dialog box opens.
-
Under Field Name, click the field that contains the values that you want.
-
Click the Comparison box, and then click the operator that you want.
-
Click the Value box, and then select or type the criteria that you want.
-
To use more advanced conditions on the view, click Advanced.
This opens the Advanced Condition dialog box where you can customize the sort order using XPath expressions. -
To add another clause to the condition criteria, click the And/Or box at the end of the existing clause, and then:
-
Click And to create a condition criteria where the data must match the criteria in both clauses.
-
Click Or to create a condition criteria where the data must match the criteria in only one clause
-
-
Below the existing clause, click the message Click here to add a new clause.
-
Repeat steps 4-7 to create an additional clause for the condition criteria.
-
If you're showing or hiding data with the condition, click OK to close the dialog box. To apply special formatting to the condition, click Set Style.
-
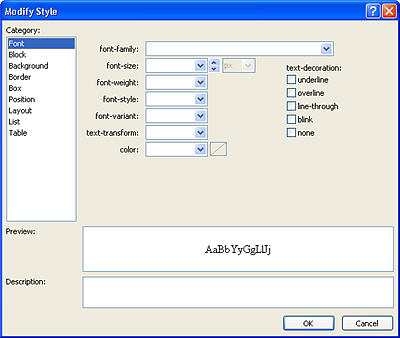
The Modify Style dialog box opens.
-
Choose the formatting options you want to apply to the Data View.
For example, to make the text bold with a yellow background, you would choose bold in the font-weight menu. Then, click the Background category and in the background-color menu, type yellow or choose a variation of yellow. -
Click OK.
Because List and Data Views display live data, you see the conditional formatting applied immediately in Design view.
Paging
With Paging, you can change the number of records that display on each page of a List or Data View. You can set up the view so that it displays items in sets of 5, 10, or any given value. Site visitors, as a result, will see back and next links in the browser, which they use to navigate the view. Alternatively, you can specify a limit for the maximum number of items to be displayed in the view, which again, can be 5, 10, or any given value.
Perform the following steps to add a paging value to a List or Data View.
With your view open in SharePoint Designer 2010, click the Options tab and then click Paging  .
.
-
Choose one of the paging options:
-
Display Sets of Items: Choose whether to display items in sets of 1, 5, 10, or 30.
Selecting this option displays navigation links in the view when the total number of records exceeds the number specified in this option.
-
Limit to Items: Choose a maximum number of items to display in the view, 1, 5, 10, or 30.
-
-
Choose More Paging Options to specify a custom value for the Data View paging.
-
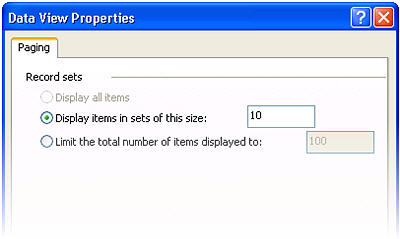
The Data View Properties dialog box opens.
-
On the Paging tab, select one of the following options:
-
Choose Display items in sets of this size and then specify a number in the box provided.
The default value in this option is 10 if there are more than 25 records in the view, and 6 if the view has fewer than 25 records. -
Choose Limit the total number of items displayed to and then specify a number in the box provided.
The default value in this field is set to 100.
-
-
Click OK.
In addition to changing the number of records that display for the view on a web page, you can change the number of records that appear in Design view of SharePoint Designer 2010. You might do this when you want to see how a view will render with a certain number of records. To change the number of records in Design view, click the Design tab and in the Preview group, choose one of the available Data View Preview options.
Enable inline editing
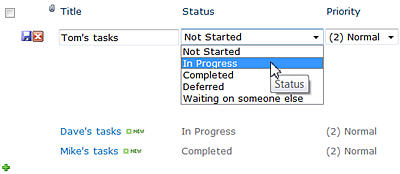
When inline editing is enabled, site visitors can easily edit each record in the context of the view without having to leave the page or open a new window. They simply click an edit button beside the column or row in the Data View, and each field becomes editable. Text boxes, menus, and field controls are available for each record in the same way they're available on new and edit item forms. Inline editing combines the best of a view and a form in one place.
Perform the following steps to enable inline editing for a List or Data View.
With your view open in SharePoint Designer 2010, click the Options tab and then click Inline Editing  .
.
For List Views, this enables new and edit links, which site visitors use to create and edit records.
-
For Data Views, choose one or all of the following inline editing options:
-
Show Edit Item Links: Enables an edit link that users click to edit the record inline.
-
Show Insert Item Links: Enables an insert link that users click to create new records inline.
-
Show Delete Item Links: Enables a delete link that users click to delete records inline.
-
-
Save changes to your list or Data View.
For list views, the next time you open the view in a browser and hover over a row or column, you see an Edit  button. For Data Views, you see an Edit link beside each row or column.
Click the link to start editing the row or column of records inline as shown below.
Enable asynchronous updates
Asynchronous updates are a core component of the ASP.NET AJAX platform, and you can enable them for list and Data Views on your site. When you enable asynchronous updates, the list or Data View retrieves data from the server in real-time and renders it in a browser without the user having to refresh the page. List and Data Views with Asynchronous updates are ideal for data rich, dynamic web pages and dashboards.
Note: Asynchronous updates can be disabled in Central Administration, so if this option is not available, consult with your server administrator
.
Perform the following steps to enable asynchronous updates for a List or Data View.
With your view open in SharePoint Designer 2010, click the Options tab and then check the Asynchronous Update box.

-
To add a refresh button to the page, check the Refresh Button box.
This allows site visitors to click a refresh button to manually refresh the page.
 -
Choose a refresh interval: 15 Seconds, 30 Seconds, or 60 Seconds.
-
Save changes to your list or Data View.
Add toolbar options
If your view uses a list or library as its data source, you can add a SharePoint list toolbar to the view so that users can work more effectively with the underlying list or library. The SharePoint list toolbar is the menu bar at the top of a list or library that provides various options to work with that list or library. There are two kinds of toolbars you can add:
-
SharePoint Toolbar offers list editing options, such as adding new items, creating views and columns, and editing the properties of the list.
-
Grouping Toolbar offers list viewing options like changing filtering, sorting, and grouping.
Perform the following steps to add the toolbar to a List or Data View.
With your view open in SharePoint Designer 2010, click the Design tab and then click Options  .
.
-
To add a complete toolbar with list editing options, click SharePoint Toolbar.
-
To add a toolbar with list viewing options, click Grouping Toolbar.
Note: The toolbar applies filtering in the presentation of the view and not at the query level. As such, you should rely on this as you're primary means of filtering the view. For that, you should use the filtering as described earlier in this article.
-
To remove the toolbar, click None.
-
Save changes to your list or Data View.
When you open the view in the browser, you will see the toolbar at the top of the page. If you enable both the SharePoint Toolbar and the Grouping Toolbar, you would see these options at the top of the view.

Apply view styles
When you create a list or Data View, by default the data is typically displayed in a basic table layout. You can change the layout of the view quickly and easily by applying a different view style. For example, you can change the basic table layout of your view to one that presents the view with borders, columns, or bulleted lists.
Before you apply a view style to a list or Data View, it's important to note that any previous customizations and Web Part connections will be removed.
Perform the following steps to apply a view style to a List or Data View.
With your view open in SharePoint Designer 2010, click the Design tab and then click one of the view styles based on the preview and hover text description.

Note: You'll see different view styles available depending on whether you're applying them to a List View or a Data View. Also, the number of styles will depend on what has been uploaded to the Styles Gallery in the site collection.
-
To see more style, click More
 in the lower right corner of the View Styles group.
 -
A warning message displays information you that any custom formatting and Web Part connections will be removed if you change the view style. Click Yes to proceed.
Note: If you choose a style that displays fewer fields than your original view, those fields are removed from the view.
-
Save changes to your list or Data View.
More customization options
In addition to the above customizations, you can customize a list or Data View in the following ways:
-
Create a formula column that displays the result of a calculation of other columns in the view. This is similar to the way you use formulas in a spreadsheet program. You might, for example, multiply the unit price of a product by the number of units in stock to display the total value of items in a separate column.
-
Display data from multiple sources in a single view. This is powerful way to combine data sources in one place. You may, for example, show product categories from one list and product information from another list in the same view.
-
Add parameters to a list or Data View. You may, for example, want to pass a parameter from another menu to the Data View and filter data by that parameter value.
-
Add server controls to the list or Data View. You can bind SharePoint controls, ASP.NET controls, and more to a data source and add them to a view to create rich, interactive data interfaces for your users.
-
Change font and formatting for the list or Data View. You can change the font size, font color, font family, and more of the column headings and fields. You might do this manually using the WYSIWYG tools in SharePoint Designer 2010 or apply CSS styles to these elements on the page.
-
Customize the table layout of the list or Data View. You can add and remove table cells, change the width or height of a row or column, show or hide the borders or shading, and much more using the table editing options in SharePoint Designer 2010.
No comments:
Post a Comment