Equations for calculating trendlines
Linear
Calculates the least squares fit for a line represented by the following equation:

where m is the slope and b is the intercept.
Polynomial
Calculates the least squares fit through points by using the following equation:

where b and  are constants.
Logarithmic
Calculates the least squares fit through points by using the following equation:

where c and b are constants, and ln is the natural logarithm function.
Exponential
Calculates the least squares fit through points by using the following equation:

where c and b are constants, and e is the base of the natural logarithm.
Power
Calculates the least squares fit through points by using the following equation:

where c and b are constants.
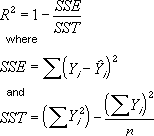
R-squared Value

Note: The R-squared value you can display with a trendline is not an adjusted R-squared value. For logarithmic, power, and exponential trendlines, Microsoft Graph uses a transformed regression model.
Moving Average

Note: The number of points in a moving average trendline equals the total number of points in the series less the number you specify for the period.
No comments:
Post a Comment