Filter data from your chart in Office 2016 for Mac
-
To work with a subset of data, select your chart and then on the Chart Design tab, click Edit Data in Excel.
Note: This step only applies when you are filtering charts in Word and PowerPoint.

-
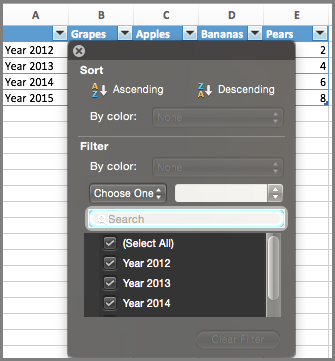
In Excel, select the category title and then in the Home tab, click Sort & Filter > Filter.

-
Next, click the drop-down arrow to select the data you want to show, and deselect the data you don't want to show.

No comments:
Post a Comment