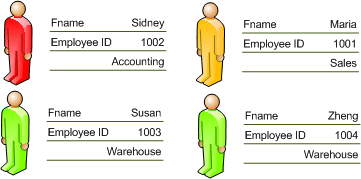
Color shapes according to their data
With the Color by Value option of the Data Graphics feature, you can apply color to indicate unique values or ranges of values. For more information about the Data Graphics feature, see Enhance your data with data graphics.
-
Unique value You can apply the same color to all of the shapes that have the same value. For example, you can color all the shapes for employees in the sales department yellow and all the shapes for employees in the accounting department red.

-
Range of values You can use a range of colors, from bright to muted, to indicate a range of values. For example, you can use a range of colors that pale from red to pink to correspond to regions with high, medium, and low increases in sales.

Color shapes by value
-
On the Data menu, click Display Data on Shapes.
-
In the Data Graphics task pane, right-click the data graphic that you want to color code, and then click Edit Data Graphic on the shortcut menu.
-
In the Edit Data Graphic dialog box, click New Item, and then click Color by Value.
-
In the New Color by Value dialog box, under Display, select an item from the Data field list.
-
Under Coloring method, do one of the following:
-
Select Each color represents a unique value to apply the same color to all shapes that have the same value.
The Color assignments list shows all the available values and assigns a fill color and text color to each value. To select a different fill or text color, click the Fill Color or Text Color arrow.
-
Select Each color represents a range of values to use a range of colors, from bright to muted, to indicate a range of values.
The Color assignments list shows a list of possible value ranges and assigns a fill color and text color to each range. Type different values into the Value 1 and Value 2 boxes to create custom ranges. To select different fill and text colors for each value, click the Fill Color or Text Color arrow. However, to preserve the bright-to-muted effect of the color sets, we recommend that you choose a different color for only the first item in the Color assignments list.
-
-
To apply the settings to shapes in your drawing, click OK first in the New Color by Value dialog box and then in the Edit Data Graphic dialog box.
No comments:
Post a Comment