After you create a PivotTable, you'll see the Field List. You can change the design of the PivotTable by adding and arranging its fields. If you want to sort or filter the columns of data shown in the PivotTable, see Sort data in a PivotTable and Filter data in a PivotTable.

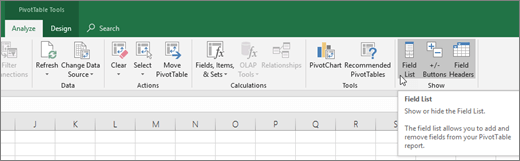
The Field List should appear when you click anywhere in the PivotTable. If you click inside the PivotTable but don't see the Field List, open it by clicking anywhere in the PivotTable. Then, show the PivotTable Tools on the ribbon and click Analyze> Field List.
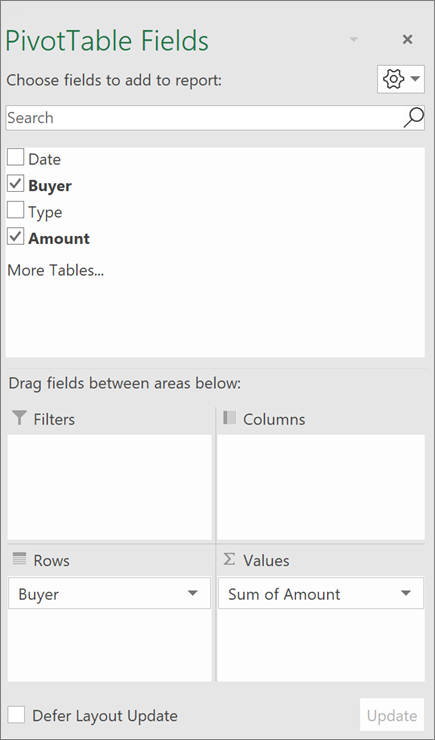
The Field List has a field section in which you pick the fields you want to show in your PivotTable, and the Areas section (at the bottom) in which you can arrange those fields the way you want.
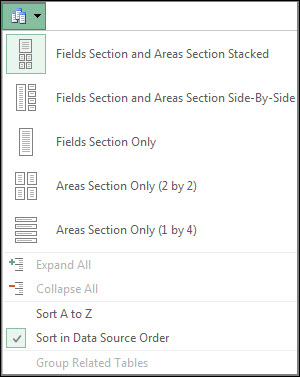
Tip: If you want to change how sections are shown in the Field List, click the Tools button  and then pick the layout you want.
Add and rearrange fields in the Field List
Use the field section of the Field List to add fields to your PivotTable, by checking the box next to field names to place those fields in the default area of the Field List.
NOTE: Typically, nonnumeric fields are added to the Rows area, numeric fields are added to the Values area, and Online Analytical Processing (OLAP) date and time hierarchies are added to the Columns area.
Use the areas section (at the bottom) of the Field List to rearrange fields the way you want by dragging them between the four areas.
Fields that you place in different areas are shown in the PivotTable as follows:
-
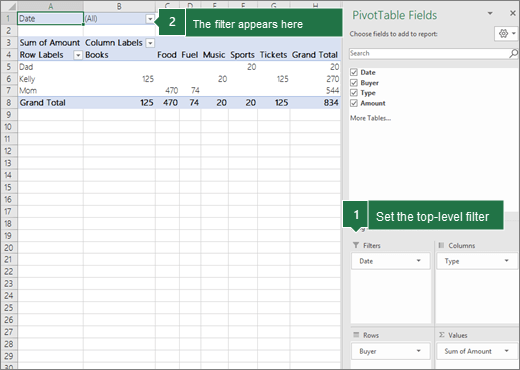
Filters area fields are shown as top-level report filters above the PivotTable, like this:
-
Columns area fields are shown as Column Labels at the top of the PivotTable, like this:

Depending on the hierarchy of the fields, columns may be nested inside columns that are higher in position.
-
Rows area fields are shown as Row Labels on the left side of the PivotTable, like this:
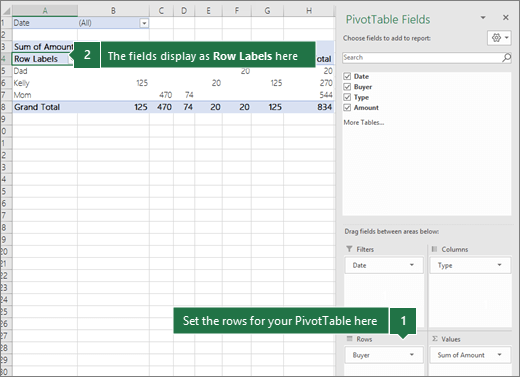
Depending on the hierarchy of the fields, rows may be nested inside rows that are higher in position.
-
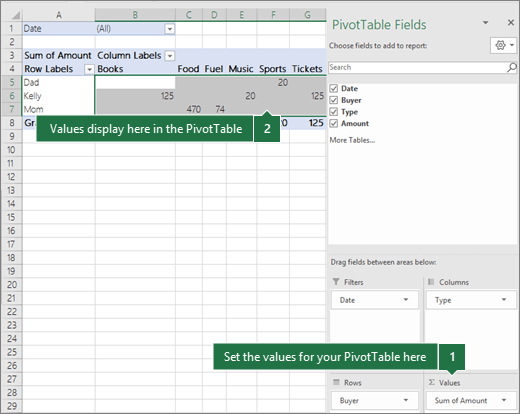
Values area fields are shown as summarized numeric values in the PivotTable, like this:
If you have more than one field in an area, you can rearrange the order by dragging the fields into the precise position you want. To delete a field from the PivotTable, drag the field out of its areas section.
More about PivotTables
If a workbook you've opened in Excel for the web has a PivotTable, you can use the Field List to add, remove, or arrange its fields. It appears when you click anywhere in the PivotTable. If you don't see the Field List, try right-clicking anywhere in the PivotTable to click Show Field List.
The Field List has a field section where you'll pick the fields you want to show in your PivotTable, and an areas section where you can drag fields between areas to arrange them the way you want.
To add fields to your PivotTable, check the box next to a field name to place that field in an area of the areas section of the Field List. Typically:
-
Nonnumeric fields are added to the Rows area
-
Numeric fields are added to the Values area
-
Online Analytical Processing (OLAP) date and time hierarchies are added to the Columns area.
To remove fields from your PivotTable, just uncheck the box next to those fields.
Use the areas section of the Field List to rearrange fields the way you want by dragging them between the four areas.
Fields you put in the different areas are shown in the PivotTable as follows:
-
Filters area fields are shown as top-level report filters above the PivotTable.
-
Columns area fields are shown as Column Labels at the top of the PivotTable.
Depending on the hierarchy of the fields, columns may be nested inside columns that are higher in position.
-
Rows area fields are shown as Row Labels on the left side of the PivotTable.
Depending on the hierarchy of the fields, rows may be nested inside rows that are higher in position.
-
Values area fields are show as summarized numeric values in the PivotTable.
If you have multiple fields in an area, you can change their order by dragging them to the correct position. To delete a field, drag the field out of the areas section.
Need more help?
You can always ask an expert in the Excel Tech Community or get support in the Answers community.
No comments:
Post a Comment