Use reports to measure site performance and usage
If you are responsible for managing a site, you are probably asked some common questions about the site, including:
-
How many people visit my site?
-
How has site traffic changed over time?
-
Who are the top users on my site?
-
Where does the traffic come from on my site?
-
What are the most frequently accessed pages and resources on my site?
-
How can I find out where documents and other resources stand in our workflow process?
At the same time, as the manager of a Web site, you might also have some questions that you regularly want answered, such as:
-
Are there resources on my site that I can remove because they are not used or old?
-
How can I find problems on my site (such as unlinked files, slow pages, and broken hyperlinks) before they are noticed and reported by users?
These questions can seem overwhelming, but with Microsoft Office SharePoint Designer 2007 and a Windows SharePoint Services 3.0 site or a Microsoft Office SharePoint Server 2007 site, you can easily answer these questions by using the Office SharePoint Designer 2007 reports. This article shows you how to use reports to measure site performance and usage.
Important: Data for the reports generated by Office SharePoint Designer 2007 is saved on the server on which the site is hosted. Server administrators can grant or deny access to these reports. If the reports that you request contain no data, contact your server administrator for assistance. To run usage reports, you must have the View Usage Data permission, and the server administrator must turn on usage data collection on the server. By default, usage data collection on the server is turned off.
What do you want to do?
View the Site Summary report
The Site Summary report provides a high-level overview of your site, as well as links to more detailed reports. For example, you can generate a Site Summary report like the one in the following illustration.
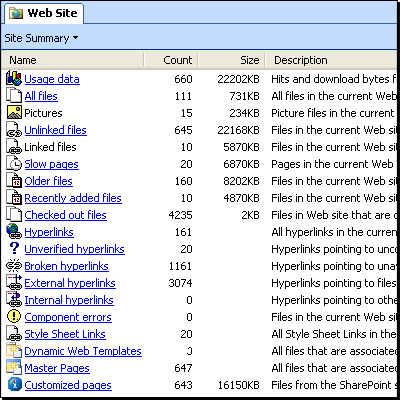
To generate a Site Summary report for your site:
-
Open the site for which you want to run the report in Office SharePoint Designer 2007.
-
On the Site menu, point to Reports, and then click Site Summary.
The report is generated.
Note: You can click the hyperlinks in the Name column to navigate to more detailed reports. For example, click Broken hyperlinks to navigate directly to the Broken Hyperlinks report.
View reports about files
You can generate reports that display all files, recently added files, recently changed files, or older files. For example, if you want to highlight new content on your site's home page or in a newsletter that promotes your site, you can use the Recently Added files report to quickly identify your new content. Alternatively, you can use the Older Files report to identify content that is old enough to be reviewed for possible updating or removal.
To run reports about files, first specify your definitions for recent and older files, and also specify how many months to show on reports by month:
-
Open the Web site for which you want to run the report in Office SharePoint Designer 2007.
-
On the Tools menu, click Application Options.
-
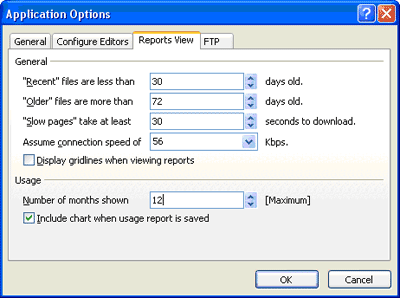
Click the Reports View tab.
-
In the "Recent" files are less than box, enter the number of days that identify a recent page.
-
In the "Older" files are more than box, enter the number of days that identify an older page.
-
In the Number of months shown box, enter the number of months that should be shown on reports by month.
-
Click OK.
Now you are ready to run the reports.
-
On the Site menu, point to Reports, point to Files, and then click the report that you want to run:
-
All Files Displays a list of all of the files in the site.
-
Recently Added Files Displays a list of the files that were added to the site within the number of days that you specified in step 4.
-
Recently Changed Files Displays a list of the files that were modified on the site within the number of days that you specified in step 4.
-
Older Files Displays a list of files that are considered "older" as determined by the number of days you specified in step 5.
-
Checkout Status Displays a list of files in your site along with the current Checkout Status of each file. (This report also includes columns of Checked Out By, Version, and Locked Date data.)
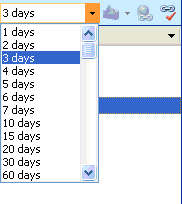
In Reports view, for reports about files, you can click options in the list to quickly change the settings for older or recent files.
-
View reports about shared content
Shared content can include master pages, customized and other pages included in the site definition, and style sheet links. Office SharePoint Designer 2007 makes it easy to locate shared content. For example, if you want to change a logo on all of the pages in your Web site, and you use master pages to control page formatting, you can use the Master Pages report to find all of the master pages on which you should change the logo. You can also use the Style Sheet Links report to find all of the style sheets that need to be updated to reflect a change in font or formatting that you want to apply across your site.
-
Open the Web site for which you want to run the report in Office SharePoint Designer 2007.
-
On the Site menu, point to Reports, point to Shared Content, and then click the report you want to run:
-
Dynamic Web Templates Displays a list of all the pages in the site, with the Dynamic Web Template column indicating whether each page is attached to a Dynamic Web Template (and if so, which one).
-
Master Pages Displays a list of all of the pages in the site, with the Master Page column indicating whether each page is attached to a master page (and if so, which one).
-
Customized Pages Displays a list of all the pages in the site, with the Customized column indicating whether any page that is based on the site definition has been customized.
-
Style Sheet Links Displays a list of all the pages in the site, with the Style Sheet Links column indicating whether each page is attached to a style sheet.
Note: The style sheet links displayed are static style sheet links (<link> tags). Dynamic style sheet links that are generated by Microsoft ASP.NET controls (such as <SharePoint:CssLink>) are not included in this report.
-
View reports about problems
Office SharePoint Designer 2007 reports about problems can help you to anticipate potential problems and fix them before users are affected. For example, you can use these reports to identify slow pages, to locate broken hyperlinks, and to find files that are candidates for deletion because they are not linked to other files. To run Problems reports, first set your preferences for how to define slow pages.
-
Open the Web site for which you want to run the report in Office SharePoint Designer 2007.
-
On the Tools menu, click Application Options.
-
Click the Reports View tab.

-
In the "Slow pages" take at least box, enter the number of seconds that define how long it takes to download a slow page.
-
In the Assume connection speed of box, enter the number of kilobits per second (Kbps) of the average user's connection speed.
-
Click OK.
Now you are ready to run the reports.
-
Click Site, point to Reports, point to Problems, and then click the report that you want to run:
-
Unlinked Files Displays a list of all the files in the site to which there are no links. This list can help you to find unused files that should be removed from the site. Note that this report does not take into account links generated by ASP.NET controls such as the Table of Contents Web Part in Office SharePoint Server 2007 sites.
-
Slow Pages Displays a list of the pages in the site that are identified as slow to load under the definition specified in step 3 and the average connection speed specified in step 4. Note that this report reflects the time required to load the page markup. It does not take into account dynamic content generated by ASP.NET controls.
-
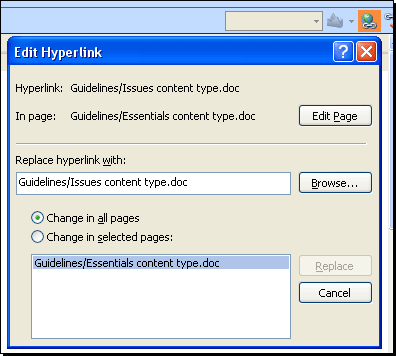
Hyperlinks Displays a list of all the hyperlinks in the site. After you run this report, a dialog box asks whether you want to verify the hyperlinks in the site. Click Yes if you want Office SharePoint Designer 2007 to step through and verify each of the hyperlinks for you. The result of this process is a list of hyperlinks with each identified as either OK or Broken. To edit any broken link, click the link in the report, and then click Edit Hyperlink on the toolbar that appears in the upper-right corner of the document window in Reports view.
Note:
-
Component Errors Displays a list of any components — such as Interactive Buttons or the hit counter (all formerly and generically known as webbots or bots) — that are currently generating errors. You can view a list of Web components by clicking Web Component on the Insert menu.
-
View the Usage Summary report
Site usage reports help answer some of the most urgent questions that site owners have about their site, such as how many people are using the site, which resources are the most popular, who uses the site the most, and from where visitors browse to the site. The Usage Summary report includes a summary of total visits, page hits, bytes downloaded, and more.
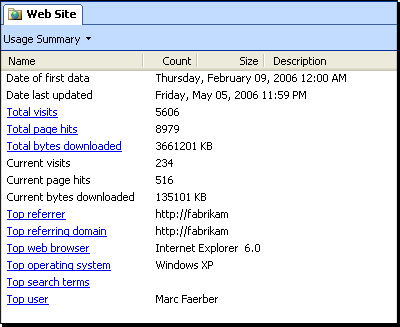
Follow these steps to run the Usage Summary report:
-
Open the Web site for which you want to run the report in Office SharePoint Designer 2007.
-
On the Site menu, point to Reports, point to Usage, and then click Usage Summary.
The report is generated. You can click any of the hyperlinked items in the Name column to view detailed reports.
View detailed usage reports
You can run detailed usage reports to answer questions about how users are accessing your site. For example, although the Usage Summary report generated in the previous section shows the total number of page hits, the Monthly Page Hits report details how many hits were counted for each page in the site. Here are the steps for running detailed Usage reports:
-
Open the Web site for which you want to run the report in Office SharePoint Designer 2007.
-
On the Site menu, point to Reports, point to Usage, and then click the report that you want to run:
-
Monthly Summary Summarizes the number of Visits, Hits, Total Hits, and Download Size on your site by month.
-
Weekly Summary Summarizes the number of Visits, Hits, Total Hits, and Download Size on your site by week.
-
Daily Summary Summarizes the number of Visits, Hits, Total Hits, and Download Size on your site by day.
-
Monthly Page Hits Summarizes the number of Total Hits and hits by month for every page in your Web site.
-
Weekly Page Hits Summarizes the number of Total Hits and hits by week for every page in your Web site.
-
Daily Page Hits Summarizes the number of Total Hits and hits by day for every page in your Web site.
-
Visiting Users Summarizes the number of visiting users and their percentage of total for a selected month.
-
Operating Systems Summarizes the count of visiting user operating systems and their percentage of total for a selected month.
-
Browsers Summarizes the count of visiting user browsers and their percentage of total for a selected month.
-
Referring Domains Summarizes the count of visits that come from a specific domain, as well as their percentage of total, for a selected month.
-
Referring URLs Summarizes the count of visits that come from a specific URL, as well as their percentage of total, for a selected month.
-
Search Strings Lists the count of search strings typed into the site's search box, as well as their percentage of total, for a selected month.
-
Chart your usage data results
You can easily create a chart that shows usage data in a graphical format, making it easier to spot trends and identify usage patterns.
-
On the Site menu, point to Reports, point to Usage, and then click the report that you want to run.
-
On the toolbar in the upper-right corner of the document window, in the Chart list, click the type of chart that you want to create, such as a Column Chart.
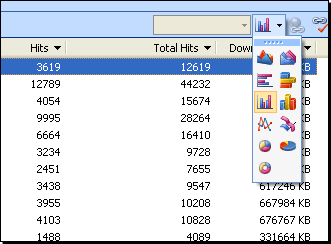
The report opens in a new window.
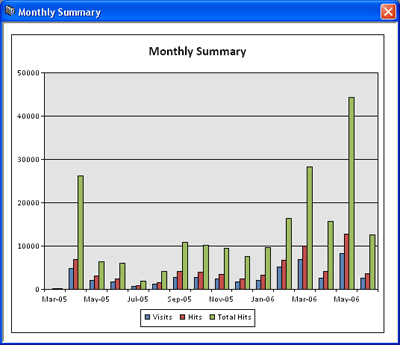
Note: By default, chart data is generated along with usage reports. If you do not find chart data when you try to run the report, on the Tools menu, click Application Options, click the Reports View tab, and then make sure that the Include chart when usage report is saved check box is selected.
Sort a report
In Reports view, you can sort a report by clicking the column headings.
Filter a report
You can narrow down the report results to see only the information you want. You can either filter on one column only or filter on multiple columns to create a progressive filter.
-
On the Site menu, point to Reports, and then click the report that you want to run.
-
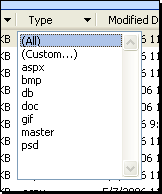
Click the arrow next to the heading of the column by which you want to filter, and then click the data for which you want to filter.
For example, when filtering by file type, you can click the arrow next to the Type column heading, and then click bmp to show only bitmap files in the report.
-
If you want to filter by more than one column, repeat step 2 for each column.
-
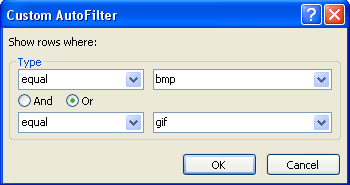
To create a custom filter on a column, click the arrow by the column heading, and then click (Custom). Enter your search criteria, and then click OK.
For example, you can use a custom autofilter to identify all of the .bmp and .gif image files in your site.
-
To clear a filter from any column, click the arrow next to the heading of that column, and then click (All).
Note: Currently applied filter settings are saved when you close the site. If you can't find files in a newly run report, filters that you applied during a previous session may be hiding those files.
To remove all filters from a report, right-click any column heading, and then click Remove Filters on the shortcut menu.
Copy a report
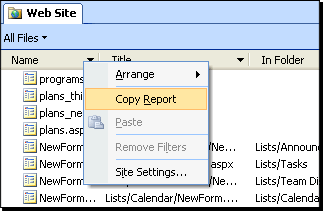
After you run a report, you might want to copy and paste the results to an e-mail message or into another document (for example, a Microsoft Office Excel worksheet). You can copy any report except the Site Summary report.
-
Right-click any column heading in the report you have run, and then click Copy Report on the shortcut menu.
-
Paste the data into the document or message.
Save a report
You can save reports if you want to use Microsoft Office Excel 2007 to view and analyze the results or to create custom charts and graphs from them.
-
On the Site menu, point to Reports, and then click the report that you want to run.
-
On the File menu, click Save. Or press CTRL+S.
-
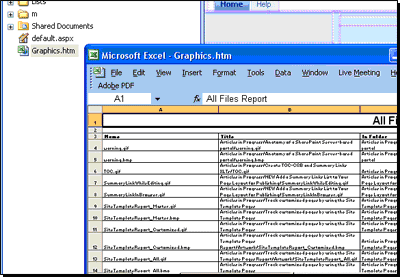
In the File name box, type a name for the report, and then click Save. The report is saved as an .htm file in your site.
-
To open the report, double-click it.
The report opens in Office Excel 2007.
No comments:
Post a Comment