Group or ungroup data in a PivotTable report
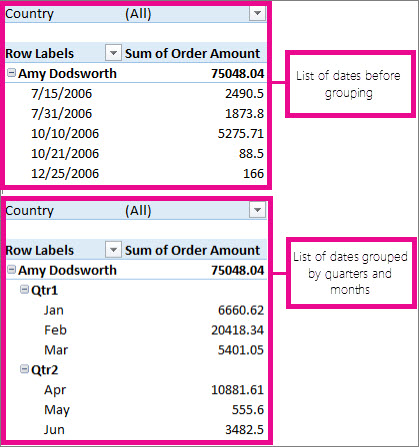
Grouping data in a PivotTable can help you show a subset of data to analyze. For example, you may want to group an unwieldy list of dates or times (date and time fields in the PivotTable) into quarters and months, like this:

Note: The time grouping feature is new in Excel 2016. With time grouping, relationships across time-related fields are automatically detected and grouped together when you add rows of time fields to your PivotTables. Once grouped together, you can drag the group to your Pivot Table and start your analysis.
Group fields
-
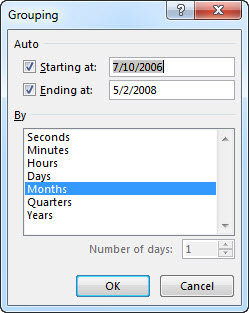
In the PivotTable, right-click any numeric or date and time field, and click Group.
-
In the Starting at and Ending at box, enter this (as needed):

-
The smallest and largest number to group numeric fields.
-
The first and last date or time you want to group by.
The entry in the Ending at box should be larger or later than the entry in the Starting at box.
-
-
In the By box, do this:
-
For numeric fields, enter the number that represents the interval for each group.
-
For date or time fields, click one or more date or time periods for the groups.
You can click additional time periods to group by. For example, you can group by Months and Weeks. Group items by weeks first, making sure Days is the only time period selected. In the Number of days box, click 7, and then click Months.
-
Tip: Date and time groups are clearly labeled in the PivotTable; for example, as Apr, May, Jun for months. To change a group label, click it, press F2, and type the name you want.
For more information about grouping, see About grouping data in a PivotTable at the end of this article.
Group date and time columns automatically (time grouping)
Note: The time grouping feature is available in Excel 2016 only.
-
In the PivotTable Fields task pane, drag a date field from the Fields area to the Rows or Columns areas to automatically group your data by the time period.
 PivotTable Field List before time grouping
Excel automatically adds calculated columns to the PivotTable used to group the date or time data. Excel will also auto collapse the data to show it in its highest date or time periods.
For example, when the Date field is checked in the Fields list above, Excel automatically adds Year, Quarter, and month (Date) as shown below.
 PivotTable Field List after time grouping
Notes: When you drag a date field from the Field List to the Rows or Columns area where a field already exists, and then put the date field above the existing field, the existing date field is removed from the Row or Columns area and the data won't be automatically collapsed so you can see this field when collapsing the data.
For a data model PivotTable, when you drag a date field with over one thousand rows of data from the Field List to the Rows or Columns areas, the Date field is removed from the Field List so Excel can display a PivotTable that overrides the one million records limitation.
Group selected items
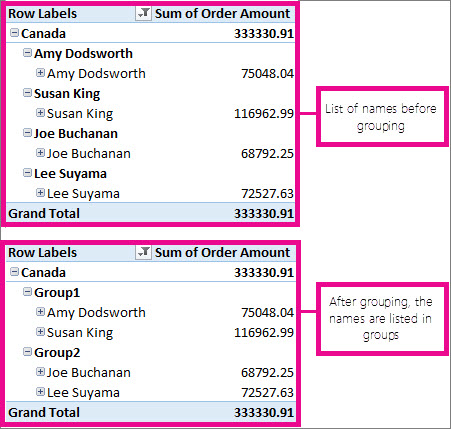
You can also select specific items and group them, like this:

-
In the PivotTable, select two or more items to group together, holding down Ctrl or Shift while you click them.
-
Right-click what you selected, and click Group.
When you group selected items, you create a new field based on the field you are grouping. For example when you group a field called SalesPerson, you create a new field called SalesPerson1. This field is added in the field section of the Field List, and you can use it like any other field. In the PivotTable, you'll see a group label, like Group1 for the first group you create. To change a group label to something more meaningful, click it, > Field Settings, and in the Custom Name box, type the name you want.
Tips: For a more compact PivotTable, you might want to create groups for all the other ungrouped items in the field.
For fields that are organized in levels, you can only group items that all have the same next-level item. For example, if the field has levels Country and City, you can't group cities from different countries.
Ungroup grouped data
To remove grouping, right-click any item in the grouped data, and click Ungroup.
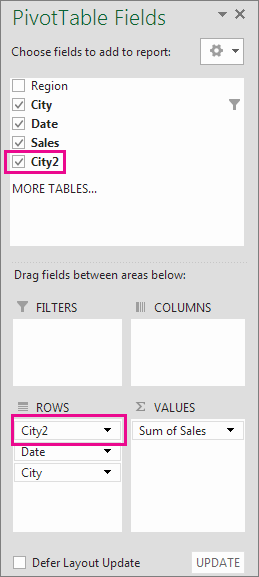
If you ungroup numeric or date and time fields, all grouping for that field is removed. If you ungroup a group of selected items, only the selected items are ungrouped. The group field won't be removed from the Field List until all groups for the field are ungrouped. For example, suppose you have four cities in the City field: Boston, New York, Los Angeles, and Seattle. You group them so that New York and Boston are in one group you name Atlantic, and Los Angeles and Seattle are in a group you name Pacific. A new field, City2, appears in the Fields area and is placed in the Rows area of the Fields List.
As shown here, the City2 field is based on the City field, and is placed in the Rows area to group the selected cities.

As shown below, the four cities are arranged under the new groups, Atlantic and Pacific.

Note: When you undo time grouped or auto collapsed fields, the first undo will remove all the calculated fields from the field areas leaving only the date field. This is consistent with how PivotTable undo worked in previous releases. The second undo will remove the date field from the field areas and undo everything.
About grouping data in a PivotTable
When you group data in a PivotTable, be aware that:
-
You can't group items for Online Analytical Processing (OLAP) source data that doesn't support the CREATE SESSION CUBE statement.
-
You can't add a calculated item to an already grouped field. You first need to ungroup the items, add the calculated item, and then regroup the items.
-
You can't use the Convert to Formulas command (PivotTable Tools > Analyze> OLAP Tools) when you have one or more grouped items. Ungroup the grouped items before using this command.
-
You can't create slicers for OLAP hierarchies with grouped fields.
-
Excel 2016 only: You can turn off time grouping in PivotTables (including data model PivotTables) and Pivot Charts by editing your registry.
No comments:
Post a Comment