Format elements of a chart
You can change the format of individual chart elements, such as the chart area, plot area, data series, axes, titles, data labels, or legend.
Two sets of tools are available for formatting chart elements: the Format task pane and the Chart Tools Ribbon. For the most control, use the options in the Format task pane.
Format your chart using the Format task pane
Select the chart element (for example, data series, axes, or titles), right-click it, and click Format <chart element>. The Format pane appears with options that are tailored for the selected chart element.
Clicking the small icons at the top of the pane moves you to other parts of the pane with more options. If you click on a different chart element, you'll see that the task pane automatically updates to the new chart element.
For example, to format an axis:
-
Right-click the chart axis, and click Format Axis.
-
In the Format Axis task pane, make the changes you want.
You can move or resize the task pane to make working with it easier. Click the chevron in the upper right.
-
Select Move and then drag the pane to a new location.
-
Select Size and drag the edge of the pane to resize it.
-
Format your chart using the Ribbon
-
In your chart, click to select the chart element that you want to format.
-
On the Format tab under Chart Tools, do one of the following:
-
Click Shape Fill to apply a different fill color, or a gradient, picture, or texture to the chart element.

-
Click Shape Outline to change the color, weight, or style of the chart element.
-
Click Shape Effects to apply special visual effects to the chart element, such as shadows, bevels, or 3-D rotation.
-
To apply a predefined shape style, on the Format tab, in the Shape Styles group, click the style that you want. To see all available shape styles, click the More button
 .
.
-
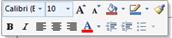
To change the format of chart text, select the text, and then choose an option on the mini toolbar that appears. Or, on the Home tab, in the Font group, select the formatting that you want to use.
-
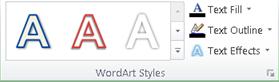
To use WordArt styles to format text, select the text, and then on the Format tab in the WordArt Styles group, choose a WordArt style to apply. To see all available styles, click the More button
.
-
You can use the Format <Chart Element> dialog box to make formatting changes, or you can apply predefined or custom shape styles. You can also format the text in a chart element.
What do you want to do?
Change the format of a selected chart element
-
In a chart, click the chart element that you want to change, or do the following to select the chart element from a list of chart elements:
-
Click anywhere in the chart.
This displays the Chart Tools, adding the Design, Layout, and Format tabs. -
On the Format tab, in the Current Selection group, click the arrow next to the Chart Elements box, and then select the chart element that you want to format.
Tip: Instead of using the ribbon commands, you can also right-click a chart element, click Format <Chart Element> on the shortcut menu, and then continue with step 3.
-
-
On the Format tab, in the Current Selection group, click Format Selection.
-
In the Format <Chart Element> dialog box, click a category, and then select the formatting options that you want.
Important: Depending on the selected chart element, different formatting options are available in this dialog box.
-
When you select different options in this dialog box, the changes are immediately applied to the selected chart element, making it easy to see the effects of the changes in you chart without closing the dialog box. However, because the changes are instantly applied, it is not possible to click Cancel in this dialog box. To remove changes, you must click Undo on the Quick Access Toolbar.
-
You can undo multiple changes that you made to one dialog box option as long as you did not make changes to another dialog box option in between.
-
You may want to move the dialog box so that you can see both the chart and the dialog box at the same time.
Change the shape style of a selected chart element
In a chart, click the chart element that you want to change, or do the following to select the chart element from a list of chart elements:
-
Click anywhere in the chart.
This displays the Chart Tools, adding the Design, Layout, and Format tabs. -
On the Format tab, in the Current Selection group, click the arrow next to the Chart Elements box, and then select the chart element that you want to format.
- Choose the chart element you want to change
- Shape style
- Shape fill
- Shape outline
- Shape effect
To apply a predefined shape style, on the Format tab, in the Shape Styles group, click the style that you want.
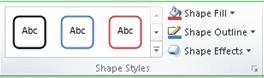
Tip: To see all available shape styles, click the More button  .
.
To apply a different shape fill, click Shape Fill, and then do one of the following:
-
To use a different fill color, under Theme Colors or Standard Colors, click the color that you want to use.
Tip: Before you apply a different color, you can quickly preview how that color affects the chart. When you point to colors that you may want to use, the selected chart element will be displayed in that color on the chart.
-
To remove the color from the selected chart element, click No Fill.
-
To use a fill color that is not available under Theme Colors or Standard Colors, click More Fill Colors. In the Colors dialog box, specify the color that you want to use on the Standard or Custom tab, and then click OK.
Custom fill colors that you create are added under Recent Colors so that you can use them again. -
To fill the shape with a picture, click Picture. In the Insert Picture dialog box, click the picture that you want to use, and then click Insert.
-
To use a gradient effect for the selected fill color, click Gradient, and then under Variations, click the gradient style that you want to use.
For additional gradient styles, click More Gradients, and then in the Fill category, click the gradient options that you want to use. -
To use a texture fill, click Texture, and then click the texture that you want to use.
To apply a different shape outline, click Shape Outline, and then do one of the following:
-
To use a different outline color, under Theme Colors or Standard Colors, click the color that you want to use.
-
To remove the outline color from the selected chart element, click No Outline.
Note: If the selected element is a line, the line will no longer be visible on the chart.
-
To use an outline color that is not available under Theme Colors or Standard Colors, click More Outline Colors. In the Colors dialog box, specify the color that you want to use on the Standard or Custom tab, and then click OK.
Custom outline colors that you create are added under Recent Colors so that you can use them again. -
To change the weight of a line or border, click Weight, and then click the line weight that you want to use.
For additional line style or border style options, click More Lines, and then click the line style or border style options that you want to use. -
To use a dashed line or border, click Dashes, and then click the dash type that you want to use.
For additional dash-type options, click More Lines, and then click the dash type that you want to use. -
To add arrows to lines, click Arrows, and then click the arrow style that you want to use. You cannot use arrow styles for borders.
For additional arrow style or border style options, click More Arrows, and then click the arrow setting that you want to use.
To apply a different shape effect, click Shape Effects, click an available effect, and then select the type of effect that you want to use.
Note: Available shape effects depend on the chart element that you selected. Preset, reflection, and bevel effects are not available for all chart elements.
Change the format of text in a selected chart element
To format the text in chart elements, you can use regular text formatting options, or you can apply a WordArt format.
Use text formatting to format text in chart elements
-
Click the chart element that contains the text that you want to format.
-
Right-click the text or select the text that you want to format, and then do one of the following:
-
Click the formatting options that you want on the Mini toolbar.
-
On the Home tab, in the Font group, click the formatting buttons that you want to use.
-
Use WordArt styles to format text in chart elements
-
In a chart, click the chart element that contains the text that you want to change, or do the following to select the chart element from a list of chart elements:
-
Click anywhere in the chart.
This displays the Chart Tools, adding the Design, Layout, and Format tabs. -
On the Format tab, in the Current Selection group, click the arrow next to the Chart Elements box, and then select the chart element that you want to format.
-
-
On the Format tab, in the WordArt Styles group, do one of the following:
-
To apply a predefined WordArt style, click the style that you want.
Tip: To see all available WordArt styles, click the More button
. -
To apply a custom WordArt style, click Text Fill, Text Outline, or Text Effects, and then select the formatting options that you want.
-
No comments:
Post a Comment