Count how often a value occurs
Suppose you want to find out how many times particular text or a number value occurs in a range of cells. For example:
-
If a range, such as A2:D20, contains the number values 5, 6, 7, and 6, the number 6 occurs two times.
-
If a column contains "Buchanan", "Dodsworth", "Dodsworth", and "Dodsworth", "Dodsworth" occurs three times.
Note: The screenshots in this topic have been taken in Excel 2016. Depending on your Excel version, the screen may appear different, but the functionality will still be the same.
There are several ways to count how often a value occurs.
Count how often a single value occurs by using the COUNTIF function
Use the COUNTIF function to count how many times a particular value appears in a range of cells.
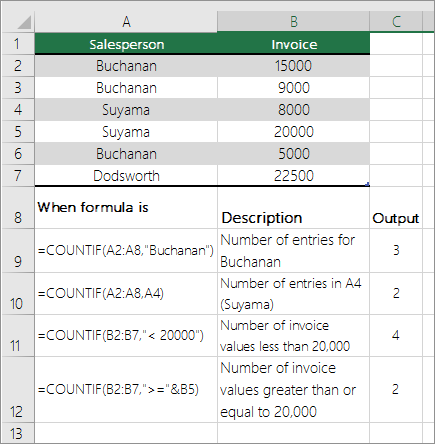
For more information, see COUNTIF function.
Count based on multiple criteria by using the COUNTIFS function
The COUNTIFS function is similar to the COUNTIF function with one important exception: COUNTIFS lets you apply criteria to cells across multiple ranges and counts the number of times all criteria are met. You can use up to 127 range/criteria pairs with COUNTIFS.
The syntax for COUNTIFS is:
COUNTIFS(criteria_range1, criteria1, [criteria_range2, criteria2],…)
See the following example:
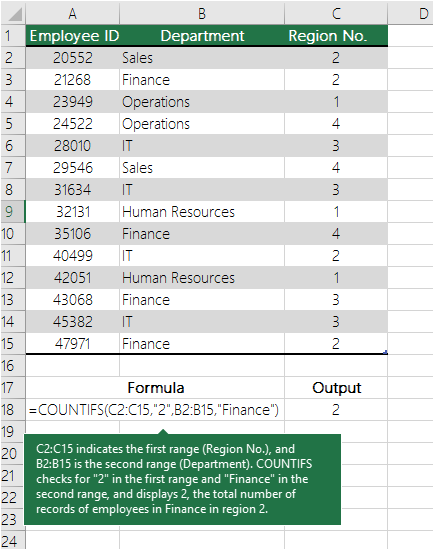
To learn more about using this function to count with multiple ranges and criteria, see COUNTIFS function.
Count based on criteria by using the COUNT and IF functions together
Let's say you need to determine how many salespeople sold a particular item in a certain region or you want to know how many sales over a certain value were made by a particular salesperson. You can use the IF and COUNT functions together; that is, you first use the IF function to test a condition and then, only if the result of the IF function is True, you use the COUNT function to count cells.
Notes:
-
The formulas in this example must be entered as array formulas. If you have opened this workbook in Excel for Windows or Excel 2016 for Mac and want to change the formula or create a similar formula, press F2, and then press Ctrl+Shift+Enter to make the formula return the results you expect. In earlier versions of Excel for Mac, use
 +Shift+Enter.
 -
For the example formulas to work, the second argument for the IF function must be a number.
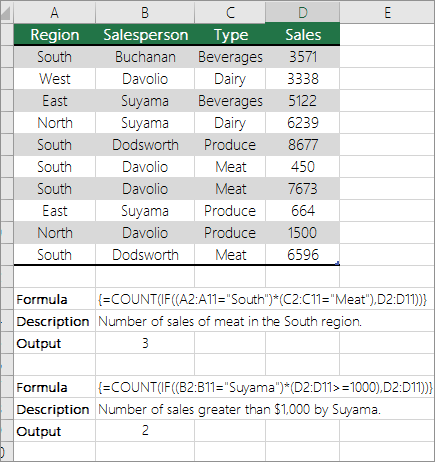
To learn more about these functions, see COUNT function and IF function.
Count how often multiple text or number values occur by using the SUM and IF functions together
In the examples that follow, we use the IF and SUM functions together. The IF function first tests the values in some cells and then, if the result of the test is True, SUM totals those values that pass the test.
Example 1
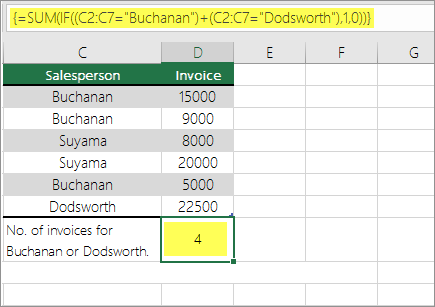
The above function says if C2:C7 contains the values Buchanan and Dodsworth, then the SUM function should display the sum of records where the condition is met. The formula finds three records for Buchanan and one for Dodsworth in the given range, and displays 4.
Example 2
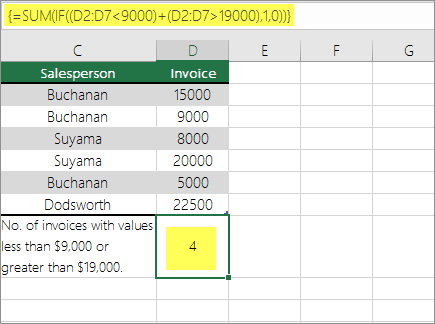
The above function says if D2:D7 contains values lesser than $9000 or greater than $19,000, then SUM should display the sum of all those records where the condition is met. The formula finds two records D3 and D5 with values lesser than $9000, and then D4 and D6 with values greater than $19,000, and displays 4.
Example 3
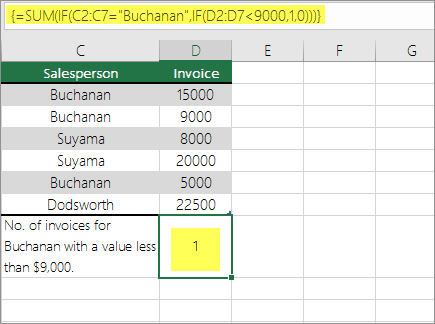
The above function says if D2:D7 has invoices for Buchanan for less than $9000, then SUM should display the sum of records where the condition is met. The formula finds that C6 meets the condition, and displays 1.
Note: The formulas in this example must be entered as array formulas. That means you press F2 and then press Ctrl+Shift+Enter. In earlier versions of Excel for Mac use +Shift+Enter.
Count how often multiple values occur by using a PivotTable
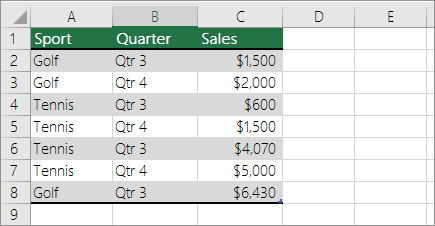
You can use a PivotTable to display totals and count the occurrences of unique values. A PivotTable is an interactive way to quickly summarize large amounts of data. You can use a PivotTable to expand and collapse levels of data to focus your results and to drill down to details from the summary data for areas that are of interest to you. In addition, you can move rows to columns or columns to rows ("pivoting") to see a count of how many times a value occurs in a PivotTable. Let's look at a sample scenario of a Sales spreadsheet, where you can count how many sales values are there for Golf and Tennis for specific quarters.
-
Enter the following data in an Excel spreadsheet.
-
Select A2:C8
-
Click Insert > PivotTable.
-
In the Create PivotTable dialog box, click Select a table or range, then click New Worksheet, and then click OK.
An empty PivotTable is created in a new sheet.
-
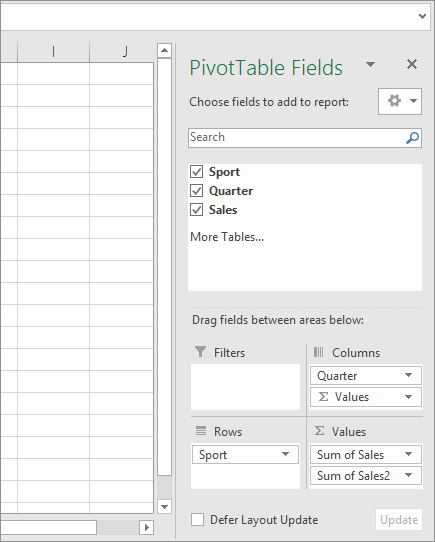
In the PivotTable Fields pane, do the following:
-
Drag Sport to the Rows area.
-
Drag Quarter to the Columns area.
-
Drag Sales to the Values area.
-
Repeat step c.
The field name displays as SumofSales2 in both the PivotTable and the Values area.
At this point, the PivotTable Fields pane looks like this:
-
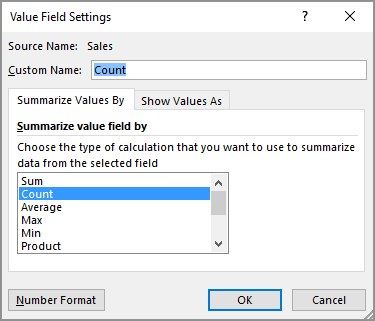
In the Values area, click the dropdown next to SumofSales2 and select Value Field Settings.
-
In the Value Field Settings dialog box, do the following:
-
In the Summarize value field by section, select Count.
-
In the Custom Name field, modify the name to Count.
-
Click OK.
-
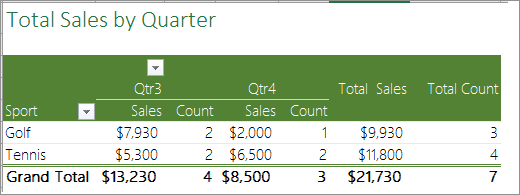
The PivotTable displays the count of records for Golf and Tennis in Quarter 3 and Quarter 4, along with the sales figures.
-
Do you have a specific Excel question?
Help us improve Excel
Do you have suggestions about how we can improve the next version of Excel? If so, please check out the topics at Excel User Voice
No comments:
Post a Comment