Using Solver to schedule your workforce
 This article was adapted from Microsoft Office Excel 2007 Data Analysis and Business Modeling by Wayne L. Winston. Visit Microsoft Learning to learn more about this book.
This classroom-style book was developed from a series of presentations by Wayne Winston, a well known statistician and business professor who specializes in creative, practical applications of Excel. So be prepared — you may need to put your thinking cap on.
In this article
Overview
Many organizations (such as banks, restaurants, and postal service companies) know what their labor requirements will be at different times of the day, and need a method to efficiently schedule their workforce. You can use Microsoft Office Excel Solver to easily solve workforce scheduling problems.
-
How can I efficiently schedule my workforce to meet labor demands?
How can I efficiently schedule my workforce to meet labor demands?
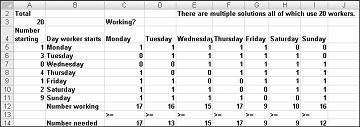
Bank 24 processes checks 7 days a week. The number of workers needed each day to process checks is shown in row 14 of the file Bank24.xlsx, which is shown in Figure 28-1. For example, 13 workers are needed on Tuesday, 15 workers are needed on Wednesday, and so on. All bank employees work 5 consecutive days. What is the minimum number of employees Bank 24 can have and still meet its labor requirements?

We begin by identifying the target cell, changing cells, and constraints for our Solver model.
-
Target cell. Minimize total number of employees.
-
Changing cells. Number of employees who start work (the first of five consecutive days) each day of the week. Each changing cell must be a non-negative integer.
-
Constraints. For each day of the week, the number of employees who are working must be greater than or equal to the number of employees required. (Number of employees working)>=(Needed employees)
To set up our model, we need to track the number of employees working each day. I began by entering in the cell range A5:A11 trial values for the number of employees who start their five-day shift each day. For example, in A5, I entered 1, indicating that 1 employee begins work on Monday and works Monday through Friday. I entered each day's required workers in the range C14:I14.
To track the number of employees working each day, I entered a 1 or a 0 in each cell in the range C5:I11. The value 1 in a cell indicates that the employees who started working on the day designated in the cell's row are working on the day associated with the cell's column. For example, the 1 in cell G5 indicates that employees who started working on Monday are working on Friday; the 0 in cell H5 indicates that the employees who started working on Monday are not working on Saturday.
By copying from C12 to D12:I12 the formula =SUMPRODUCT($A$5:$A$11,C5:C11), I compute the number of employees working each day. For example, in cell C12, this formula evaluates to =A5+A8+A9+A10+A11, which equals (Number starting on Monday)+ (Number starting on Thursday)+(Number starting on Friday)+(Number starting on Saturday)+ (Number starting on Sunday). This total is indeed the number of people working on Monday.
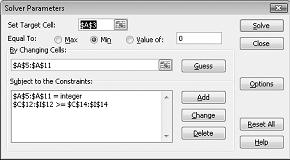
After computing the total number of employees in cell A3 with the formula =SUM(A5:A11), I can enter our model in Solver as shown in Figure 28-2.

In the target cell (A3), we want to minimize the number of total employees. The constraint C12:I12>=C14:I14 ensures that the number of employees working each day is at least as large as the number needed each day. The constraint A5:A11=integer ensures that the number of employees beginning work each day is an integer. To add this constraint, I clicked Add in the Solver Parameters dialog box and filled in the Add Constraint dialog box as shown in Figure 28-3.

I also selected the options Assume Linear Model and Assume Non-Negative for the changing cells by clicking Options in the Solver Parameters dialog box and then checking these boxes in the Solver Options dialog box. After clicking Solve, we find the optimal solution that's shown earlier in Figure 28-1.
A total of 20 employees is needed. One employee starts on Monday, three start on Tuesday, four start on Thursday, one starts on Friday, two start on Saturday, and nine start on Sunday.
Note that this model is linear because the target cell is created by adding together changing cells, and the constraint is created by comparing the result obtained by adding together the product of each changing cell times a constant (either 1 or 0) to the required number of workers.
Problems
-
Suppose Bank 24 had 22 employees and that the goal was to schedule employees so that they would have the maximum number of weekend days off. How should the workers be scheduled?
-
Suppose Bank 24 employees are paid $150 per day the first five days they work and can work a day of overtime at a cost of $350. How should the bank schedule its employees?
-
The number of telephone reservation operators needed by an airline during each time of day is as follows:
| Time | Operators needed |
| Midnight–4 A.M. | 12 |
| 4 A.M.–8 A.M. | 16 |
| 8 A.M.–Noon | 22 |
| Noon–4 P.M. | 28 |
| 4 P.M.–8 P.M. | 31 |
| 8 P.M.–Midnight | 22 |
-
Each operator works one of the following six-hour shifts: midnight–6:00 A.M., 6:00 A.M.–noon, noon–6:00 P.M., 6:00 P.M.–midnight. What is the minimum number of operators needed?
-
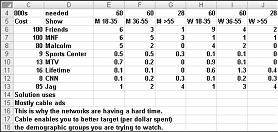
Shown below are the number of people in different demographic groups who watch various TV shows and the cost (in thousands of dollars) of placing a 30-second ad with each show. For example, it costs $160,000 to place a 30-second ad on Friends. The show is watched by 6 million males between the ages 18 and 35, 3 million males between 36 and 55, 1 million males over 55, 9 million females between 18 and 35, 4 million females between 36 and 55, and 2 million females over 55. The data also includes the number of people in each group (in millions) that we want to see the ad. For example, the advertiser wants at least 60 million 18 to 35 year old males to see its ads. What is the cheapest way to meet our goals?
 Figure 28-4 Data for Problem 4
No comments:
Post a Comment