Filtering in Power View
Filters remove all but the data you want to focus on. In Power View, there are several types of filters: Filter pane filters, cross-filters, and slicers. Slicers in Power View is covered in a separate topic.

In this article
Create a filter using the Filters area
Power View has a Filters area with basic and advanced filters for the whole view and for individual visualizations. Like slicers, filters in the Filters area are saved with the report and affect only one sheet or view, not the whole workbook or report. Unlike slicers, these filters are in their own area and not in the worksheet or view itself, so they don't take up any report design space.
-
To see the Filters area, hover over a visualization and click the Show Filters icon in the upper-right corner.
The Filters Area appears and shows the fields and measures for the visualization.
Tip: You can't create a filter on slicers or tile visualizations.
-
In Excel, on the Power View tab > Filters Area.
In Power View in SharePoint, on the Home tab > Filters Area.
-
In the Filters area:
-
To set filters for the whole sheet or view, select View.
-
To set filters for a specific visualization, click Chart (or Table or other type of visualization).
-
-
Drag fields from the Field List to the filters area.
Or click the arrow next to a field in the Field List and then click Add to filter.
-
Set filter values. See basic and advanced filters for details.
Notes:
-
When viewing an Excel workbook in the browser in Excel Services or viewing a Power View in SharePoint report in reading and full screen modes, if the Filters area is visible in design mode, you and your report viewers can see and interact with the filters in the Filters area.
-
If you set a filter in the Filters area, it continues filtering the report even if you close the Filters area.
-
You can't filter on an image field.
-
To hide the Filters area, click in a blank area of the canvas, and click the Filters Area button.
How view and visualization filters are different
Filters of the whole sheet or view are fundamentally different from filters on individual visualizations.
Sheet- or view-level filters are applied at the most detailed data level, filtering according to the values in each cell.
Visualization filters are applied at the aggregation level. For example, filtering a bar chart for Products that sold more than $1,000 means keeping products for which the sum (or other aggregate)of each bar in that chart is greater than $1,000.
View filters
View-level filters are applied to the entire Power View sheet. If the Excel file contains other Power View sheets, they aren't affected by filters I add here. The filter is applied to all visualizations in the view. If the visualization contains data impacted by the filter, it will be filtered to show that data. If the visualization does not contain data impacted by the filter, it will be unaffected.
-
In the Filters pane, ensure that View is selected.
-
You can drag other fields from the field list to the filters area, even fields that are not anywhere on the view.
Or click the arrow next to a field in the fields section of the field list and then click Add to View Filter.
-
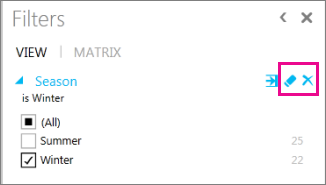
To delete a filter, click the X icon in the Filters area. To clear a filter, click the eraser icon.

Visualization filters
You can set visualization-level filters on tables, matrices, cards, and charts, but not on tile containers or slicers. However, you can set filters on the tables, matrices, and charts that are inside a tile container.
-
View filters for an individual visualization by hovering over its upper-right corner and then clicking the filter icon. This opens the filters area already populated with the fields in the visualization.
If the filters area is expanded, when you select a visualization you see the visualization type in a gray heading in the filters area. For example, if you select a chart, you see a Chart heading in the filters area. Click that heading to see the filters for the chart.
-
You can drag other fields from the field list to the filters area, even fields that are not in that visualization or anywhere on the view.
Or click the arrow next to a field in the fields section of the field list and then click Add to [Visualization] filter.
-
You can delete filters that you add to a visualization, but you can't delete the filters for fields that are in the visualization. You can clear them, though, so they have no effect.
To remove the filter, open the filters area for the visualization and delete the filter.
Tip: If you add a filter for a field in a visualization and then delete the field from the visualization, the filter remains in effect for that visualization.
Basic and advanced filters
To switch between basic and advanced filters, click the Advanced Filter Mode icon, the first to the right of the field name in the Filters area.

Advanced filter
These are different filter options.
| Basic filter | Advanced filter | |
| Text fields | Check boxes similar to AutoFilters in Microsoft Excel | Free-form boxes in which to type values that the field contains, doesn't contain, and so on. |
| A slider from the lowest to the highest value in the field. | Free-form boxes in which to type values that the field is greater than, less than, and so on. Note: You can't use a calculated field as a filter. | |
| Date fields | Date sliders or check boxes | Free-form boxes in which to type values that the field is on or after, is before, and so on. |
Tip: . The numbers after each check box value show how many records have that value. If there are more than 500 values in a field, you'll see a message that not all items are showing.
Search in filters
If you're filtering a field that has a long list of values, you can search for a specific value.
-
Under the field name in the Filters area, type text to search for in the Search box and click the magnifying glass.
Tip: If a field doesn't have a lot of values, it won't have a Search box
You can search for a value within a visualization-level or view-level filter on a text field, and then choose to filter on it or not. The portions of a field's values that match the search text are highlighted in the search results list. Search is not case-sensitive, so searching for Apple yields the same results as apple. The search is limited to the visualization or to the sheet or view, depending on the filter—it does not search the whole workbook or report.
You can also use wildcard characters—the question mark (?) and asterisk (*). A question mark matches any single character; an asterisk matches any sequence of characters. If you want to find an actual question mark or asterisk, type a tilde (~) before the character.
For example, in a list of countries, typing r?n in the Search box returns two countries, France and Iran. Typing r*n in the Search box returns ten countries, including Germany, Ireland, and Kyrgyzstan.
Note: If you use wildcard characters in your search, the matching portion isn't highlighted in the search results list.
Filter behavior in a saved Power View file
Of the different ways that you can filter data in your report, each way behaves differently when you save a report or workbook:
-
If you set a filter or slicer when designing a Power View sheet or view in Excel or SharePoint, the state of the slicer or filter is saved with the file.
-
No changes are saved in the browser in Excel Services for an Excel workbook or in reading or full-screen modes for a Power View report in SharePoint, so if you filter in those modes, those changes are not saved either.
Cross filters
Depending on which visualization is the source (doing the filtering) and which visualization is the target (being filtered), the target visualization will be either filtered or highlighted. If it is filtered, this is referred to as 1. cross-filtering.
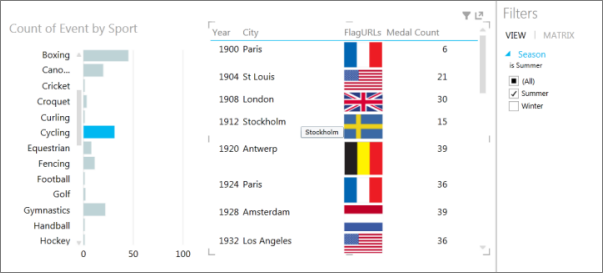
Charts can act as filters, thanks to the relationships in the underlying model. When you select values directly on the chart, it filters other data regions on a view. For example, if you select one column in a bar chart, this automatically filters the values in the matrix in the report view.

Column chart filtering a matrix
Use Ctrl + click to select multiple values. To clear the filter, click inside the filter, but not on a value.
Cross-filtering also works with charts with multiple series. Clicking one section of a bar in a stacked bar chart filters to that specific value. Clicking an item in the legend filters all the sections in that series.
Cross-filter selections are saved when you move from one sheet or view to another, but they are not saved with the workbook or report. When you save and open the workbook or report later, each chart will be back in its original state.
See Also
Filtering and highlighting in Power View
Power View: Explore, visualize, and present your data
Power View and Power Pivot videos
Tutorial: PivotTable data analysis using a Data Model in Excel 2013
No comments:
Post a Comment