With Visio, you can create illustrative diagrams, such as interconnected workflows and real-world layouts, to drive operational intelligence. With Power BI, you can build intuitive dashboards from various visualizations, like charts and maps, to understand complex datasets, KPI measures, and tracked goals—all to achieve business intelligence.
By using Visio for the web and Power BI together, you can illustrate and compare data as both diagrams and visualizations in one place to get the big picture and drive operational and business intelligence.
Want to try out various samples? See these sample Visio Power BI Visuals and then click the various Visio shapes or Power BI data charts to see the interaction.
Important: If your enterprise has configured an Azure Active Directory (AAD) conditional access settings policy to Power BI Desktop app, you may be prompted to install a browser extension when using Visio Visual to sign in and load the Visio file. Visio Visual doesn't support this scenario.
Add Visio Visuals to reports on Power BI Web
Here are the stages and steps to this procedure for getting this specific sample Visio Power BI Visuals (Sample 3).
Stage 1: Get required software and download sample files
Before you begin, make sure you have the required software.
-
To obtain Power BI, see https://powerbi.microsoft.com.
-
To obtain the sample Excel worksheet and Visio diagram, download from Lead Management Flow Data.xlsx and Marketing Lead Monitoring.vsdx.
-
Visio Visual is present in Appsource and can be used directly from within Power BI.
Stage 2: Model Power BI data and create Visio diagram
-
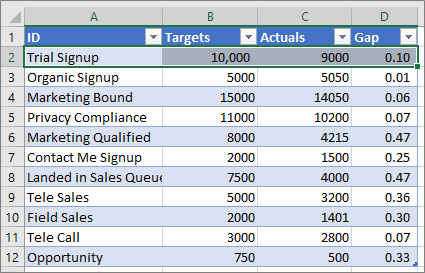
Create a set of Power BI data and make sure one column uniquely identifies each row. This column will be used to map to the shapes in the Visio diagram.
You can add additional data columns to use as Shape data. In the Lead Management Flow Data.xlsx file that you previously downloaded, the ID column uniquely identifies each row. You can also display the values in the Targets, Actuals, and Gap columns as Data Graphic fields linked to each shape.
-
Ensure that the Visio shapes that you want to link to Power BI data within your diagram have unique text, or shape data that can be used to map Power BI data to the shapes in your diagram.

The mapping process: data in the worksheet maps to each shape and its shape data
You can add and edit the mapping from within Visio Visual later as well.

Tip: To remove canvas whitespace from the diagram, select Design > Size > Fit to Drawing.
Stage 3: Create your Power BI report
-
To create a Power BI report, go to https://www.powerbi.com/ or launch Power BI Desktop, and then click the Get Data button in the bottom-left corner of the Power BI window.
-
On the Get Data screen in the Import or Connect to Data section, click Get under Files.
-
Select Lead Management Flow Data.xlsx as your data source. Data sources can be local files, files stored in One Drive or in SharePoint sites, or other data sources supported by Power BI.
-
Once your data is imported, click Datasets, and then click Create Report to create a new Power BI report.
Stage 4: Import Visio Visual into your Power BI report
-
In the Power BI report, click the ellipsis (...) button in Visualizations pane in Power BI and then select Import from marketplace.
-
Search for 'Visio', look for Visio Visual and click Add.
The new Visio custom visual appears as an icon in the Visualizations pane.
Stage 5: Insert your Visio diagram into your Power BI report
-
To add the visual to the report canvas, click the Visio Visual icon.
-
In the Fields pane, select the Power BI field which uniquely identifies Visio shapes and then add it to the ID section.
-
On the report canvas, enter the Embed URL to your Visio diagram.
If you're not sure what URL to use, open a new browser tab, navigate to the document library where the Visio drawing is stored, and click it to open in Visio for the web. Open the Embed dialog box, copy the Embed URL of the drawing, and then paste it into the Enter file URL to open Visio diagram text box on the Power BI report canvas. If you are editing the diagram, open the Embed dialog box by selecting File > Share > Embed. If you are viewing the diagram, open the Embed dialog box by selecting Show more commands (...) > Embed.
-
Click Connect.
Your Visio diagram displays in the Visio Visual and is linked to Power BI data.
-
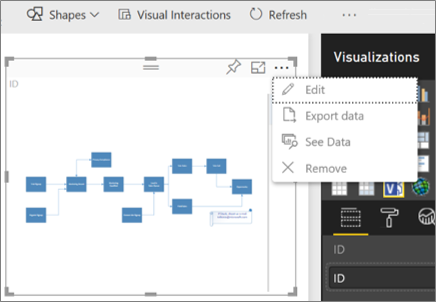
To view the diagram in Focus mode, click the ellipsis (...) button in the Visio Visual and then select Edit.
Stage 6: Link Power BI data to your Visio diagram
-
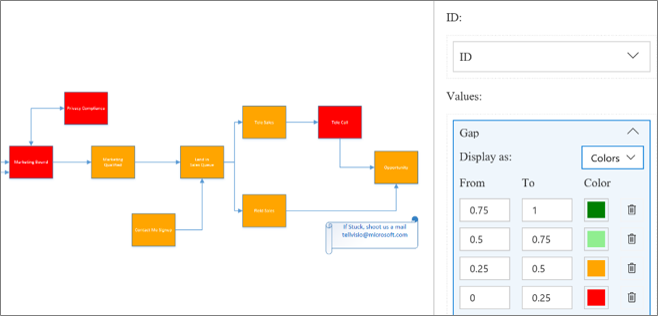
Expand the mapping window on the right side of Visio Visual. Visio Visual reads the diagram properties or Shape data and automatically links to the data by using the mapped Power BI ID rows. Default colors are applied, but you can use the customization options to change colors.
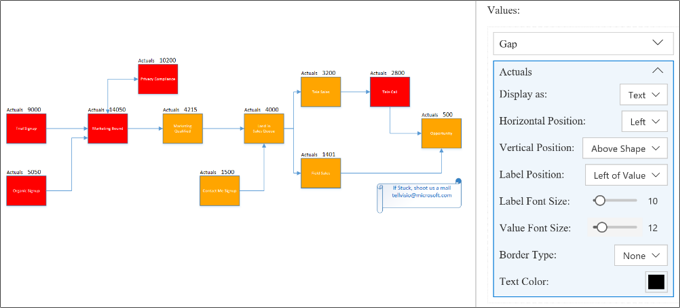
You can link additional diagram properties by clicking on Visio shapes that are not linked, and then clicking on the Power BI row.
-
To add other Power BI columns as colors or values on the diagram, select the Power BI columns, and then place them under the Values section of Visio Visual.
-
To close Focus mode, click Back to report.
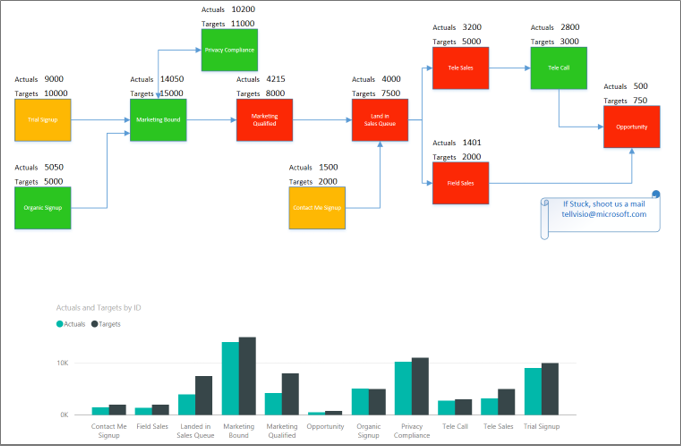
You can now pin this report to a dashboard and share the dashboard with your team.
Visio Visual supports two-way interactivity when you filter in Power BI. Click a Power BI visual element, such as the bar in the bar chart, to auto-zoom on a mapped shape in the Visio Visual.
Using Power BI Publish to Web
With Power BI Publish to web, you can embed interactive Power BI visualizations online, in blog posts, web sites, emails, or social media. Visio Visual supports Publish to web from Power BI functionality. To do this, the Visio file being embedded should have guest access, which enables web users without the need to authenticate themselves. Copy the anonymous sharing or guest access URL for the Visio file by going to OneDrive for Business or SharePoint Online, and clicking Share for the Visio file. Now paste this URL into the Enter file URL to open Visio diagram text box on the Power BI report canvas (see Stage 5: Insert your Visio diagram into your Power BI report) and follow the rest of the steps.
Sign in issues
You should be aware of the following sign in issues:
-
Visio Visual in Power BI Embedded reports A Power BI report can be embedded in apps such as Microsoft Teams or third-party apps. These apps can block pop-ups such as a sign-in prompt. In this case, the Visio Visual file needs guest access permission in SharePoint Online and OneDrive for Business. Otherwise, Visio Visual keeps prompting to sign in but the app will keep blocking the sign-in pop-up.
-
Single Sign-on authentication Visio Visual in Power BI needs access to the Visio diagram you're working with, which means you might see a sign in prompt. In cases where Power BI user sign in information can't be accessed through Single Sign-on authentication, users trying to view the Power BI report might see a sign in prompt to authenticate themselves working with the Visio Visual.
-
Internet security zones If you're still having issues with authentication while working with Visio Visual using Internet Explorer, you may have Power BI and SharePoint in different internet security zones. Add both the Power BI domain and the SharePoint domain to the same security zone in your Internet Options and then try working with the Visio Visual again. For more information, see Change security and privacy settings for Internet Explorer 11.
Improving the page load time and supporting complex diagrams
The number of shapes (over 1000) in your Visio diagrams and the complexity of those shapes (geometry, shading etc.) affect the loading time of Visio diagrams in Power BI. To improve the page load performance, remove any shapes you don't need from your Visio diagram or add them to a layer that begins with # symbol as detailed below. You can also set the themes applied to No Theme on the Design tab.
Add shapes requiring Power BI data mapping to # layers in large Visio files
Another effective way to improve page load time is to add shapes that need to be mapped to Power BI data to a layer named # or any layer starting with the character # in your large Visio file. If the diagram has a # layer, only shapes on the # layer can be mapped to Power BI data. The fewer shapes you have on the# layers, the better is the page load time.
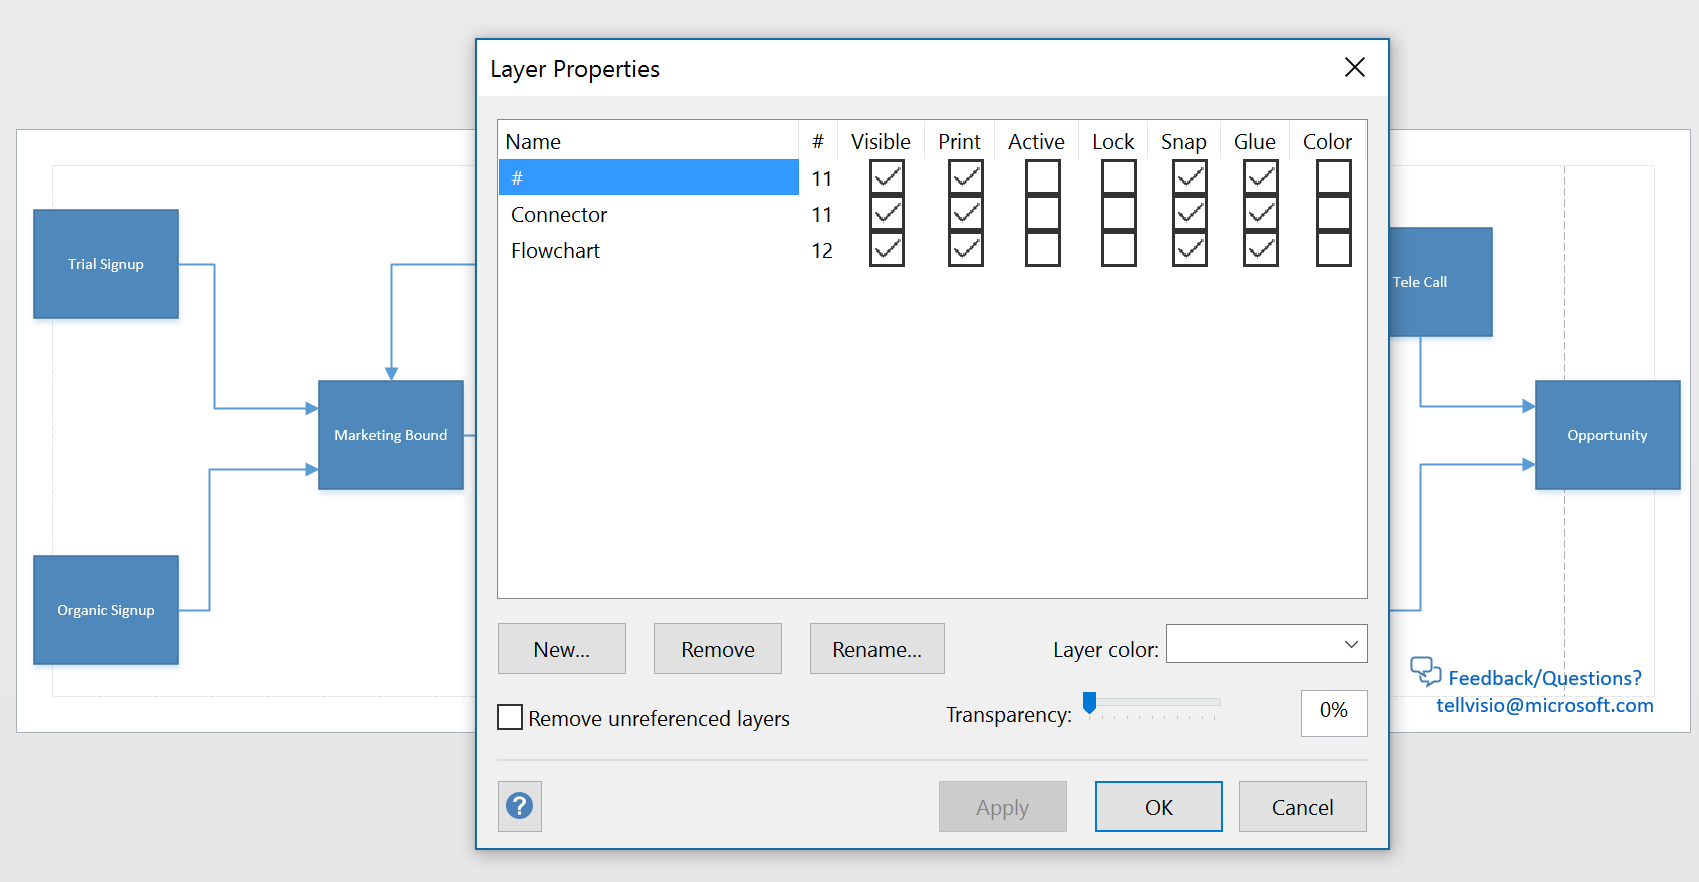
You'll also see a couple of other benefits using the # layer approach:
-
Support for complex diagrams – If your diagram has more than 1000 shapes, it can be supported if shapes requiring mapping to Power BI data are moved to# layers and the total number of shapes on# layers is less than 1000.
-
Full fidelity viewing – Some gradients and line patterns wouldn't render in the Visio Visual as expected. If these shapes do not require mapping to Power BI data, they can be left out or removed from the# layers. Visio Visual renders everything other than the shapes on the # layers in PNG format helps improve load time.
Turning auto-zoom on or off
You can change settings for auto-zoom on selection of shapes or during interactions with other visuals by turning Auto zoom to On or Off on the settings tab of the Visualizations pane.

How do I get Visio Visual?
You'll no doubt need time to figure out how your company can get the most out of the integration of Visio with Power BI. That's why we're giving Microsoft 365 subscribers five free trial instances of Visio Visual. These trial instances are fully editable and remain so indefinitely, even after the original creator has used their five instances. Plus, there's nothing to install for the trial—Visio Visual trial is immediately available in Power BI to all Microsoft 365 users. After using all trial instances, unlicensed users can still view visuals and embed file links. To retain full editing rights, you should purchase a Visio subscription. Please note, currently we can't provide these free trials to companies running a sovereign environment.
Editing a Visio Visual in Power BI requires a Visio Plan 1 or Visio Plan 2 license. You can visit our plan comparison to decide which option is best for you. If you're unsure which plan is right for you, try them for free for 30 days (Plan 1 trial, Plan 2 trial). These trials are separate from the Visio Visual trial, and you can register for both without affecting your eligibility for the other.
Important additional notes
-
Visio Visual is not supported in Power BI Report Server.
-
Data graphics applied to Visio diagrams from Visio desktop are removed so that Power BI can apply it's own graphics.
-
You might notice some visual differences between diagrams displayed in Visio desktop and in Power BI. This can happen when the diagram has complex styles, themes, and fill patterns.
-
If you add new shapes or remove shapes that map to your Power BI data and the resulting report doesn't render properly, try reinserting Visio Visual and map the shapes again.
-
If you set the values field to 'Don't summarize', then clicking on a Power BI visual will not reflect any change in Visio Visual.
-
To see Visio Visuals inside Power BI Windows app, upgrade your device to the latest Windows Creators update.
-
Visio Visuals can use only a single SharePoint Online server if Visio files are stored in Power BI mobile apps.
-
Visio Visual requires third-party cookies for *.sharepoint.com and *.powerbi.com (or respective SharePoint and Power BI domains for your company) to be allowed in the browser being used.
No comments:
Post a Comment