Process diagrams in Visio
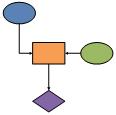
Process diagrams are visualizations of any sort of step-by-step process. They are usually created as flowcharts, with shapes that represent steps in the process connected by arrows that indicate the next step.
Visio has a lot of process diagram templates, but they all can be put into one of two categories:
General purpose process diagrams
If you want to diagram a process and you don't have a specific methodology you want to follow, one of these three templates should work well:
-
Basic Flowchart
-
Cross Functional Flowchart
-
Work Flow Diagram
To find these templates:
-
Click the File tab.
-
Click New.
-
Click Flowchart.
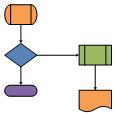
Basic Flowchart
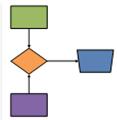
The Basic Flowchart template is useful for a broad range of business processes, where each step can be represented using simple geometric shapes.
Cross Functional Flowchart
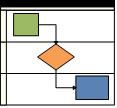
A cross functional flowchart is the same as a basic flowchart, but with an added element of structure: containers called "swimlanes" that represent the people or departments that are responsible for each step. In fact, the Cross Functional Flowchart template uses the same stencil of shapes the Basic Flowchart template uses; the main difference is that there are some swimlanes added to the page for you to start with.
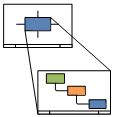
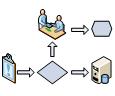
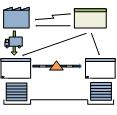
Work Flow Diagram

The Work Flow Diagram is a general-purpose pictorial diagram. It has shapes for many common business departments, objects, and steps. You can use it instead of the Basic Flowchart to show in a more representational way how a process moves through various stages.
Process diagrams for specific methodologies
Methodology-based process diagrams have more structure than general purpose diagrams have, and they can convey more detailed information. They often use symbols that have specific meanings, or require that certain kinds of data accompany certain shapes to fully implement the process. These rules or guidelines are usually described formally in specifications, most of which are available on the Web.
To find these templates:
-
Click the File tab.
-
Click New.
-
Click Flowchart or Business.
Some of the templates included in Visio to support specific process methodology diagrams include:
-
Business Process Modeling Notation Diagram
-
Fault Tree Analysis Diagram
-
IDEF0 Diagram
-
ITIL Diagram
-
Microsoft SharePoint Workflow
-
SDL Diagram
-
Six Sigma Diagram
-
TQM Diagram
-
Value Stream Map
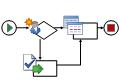
BPMN Diagram

You can create Business Process Modeling Notation (BPMN) flowcharts that follow the BPMN 1.2 standard. For more information, see Create BPMN-compliant processes.
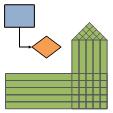
Fault Tree Analysis Diagram
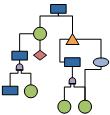
Use Fault Tree diagrams to document business processes, including Six Sigma and ISO 9000 processes. For more information, see Create a fault tree analysis diagram.
IDEF0 Diagram
Create hierarchical diagrams for model configuration management, need and benefit analyses, requirements definitions, and continuous improvement models by using IDEF0 process charting models. For more information, see Create IDEF0 diagrams.
ITIL Diagram
Document best practices in the management of information technology service processes based on the Information Technology Infrastructure Library standard. For more information, see Create an ITIL diagram.
Microsoft SharePoint Workflow
You can create annotated workflow diagrams for SharePoint 2010 in Visio, and then export them for configuration in SharePoint Designer.
SDL Diagram
Draw object-oriented diagrams for communications and telecommunications systems and networks using the Specification and Description Language.
Six Sigma Diagram
Use this template to create a Six Sigma flowchart or house of quality diagram. For more information, see Create a Six Sigma flowchart or House of Quality diagram.
TQM Diagram
Create Total Quality Management diagrams, including cause-and-effect, top-down, and cross-functional process flow diagrams for business process re-engineering and continuous improvement.
Value Stream Map
Illustrate the flow of material and information in a Lean manufacturing process by using Value stream maps. For more information, see Create a value stream map.
Really well information. Thanks a lot. Here, I got the special deals for Microsoft Visio Professional 2016 and many more .Our specialty is quick email delivery. You will get 24/7 support. So let’s check it out.
ReplyDelete