Analyze trends in data using sparklines
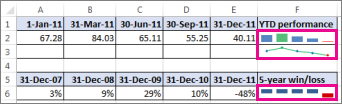
Sparklines are tiny charts inside single worksheet cells that can be used to visually represent and show a trend in your data. Sparklines can draw attention to important items such as seasonal changes or economic cycles and highlight the maximum and minimum values in a different color. Showing trends in your worksheet data can be useful, especially when you're sharing your data with other people.
-
Select a blank cell near the data you want to show in a sparkline.
-
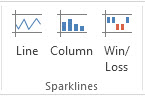
On the Insert tab, in the Sparklines group, click Line, Column, or Win/Loss.
-
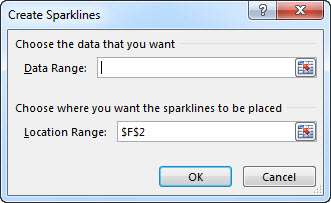
In the Data Range box, enter the range of cells that has the data you want to show in the sparkline.
For example, if your data is in cells A, B, C, and D of row 2, enter A2:D2.
If you'd rather select the range of cells on the worksheet, click
 to temporarily collapse the dialog box, select the cells on the worksheet, and then click
  to show the dialog box in full.
 -
Click OK.
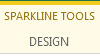
The Sparkline Tools appear on the ribbon. Use the commands on the Design tab to customize your sparklines.
Tips
-
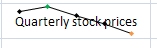
Because a sparkline is embedded in a cell, any text you enter in the cell uses the sparkline as its background, as shown in the following example.
-
If you select one cell, you can always copy a sparkline to other cells in a column or row later by dragging or using Fill Down (Ctrl+D).
Customize your sparklines
After you create sparklines, you can change their type, style, and format at any time.
-
Select the sparklines you want to customize to show the Sparkline Tools on the ribbon.
-
On the Design tab, pick the options you want. You can:
-
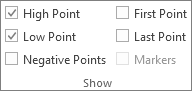
Show markers to highlight individual values in line sparklines.
-
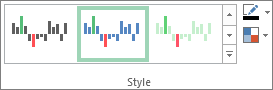
Change the style or format of sparklines.
-
Show and change axis settings.

-
Change the way data is shown.

-
No comments:
Post a Comment