Introduction to what-if analysis
By using what-if analysis tools in Microsoft Excel, you can experiment with several different sets of values in one or more formulas to explore all the various results.
For example, you can perform what-if analysis to build two budgets that each assumes a certain level of revenue. Or, you can specify a result that you want a formula to produce, and then determine what sets of values will produce that result. Excel provides several different tools to help you perform the type of analysis that fits your needs.
In this article
Overview
What-if analysis is the process of changing the values in cells to see how those changes will affect the outcome of formulas on the worksheet.
Three kinds of what-if analysis tools come with Excel: scenarios, data tables, and Goal Seek. Scenarios and data tables take sets of input values and determine possible results. A data table works only with one or two variables, but it can accept many different values for those variables. A scenario can have multiple variables, but it can accommodate only up to 32 values. Goal Seek works differently from scenarios and data tables in that it takes a result and determines possible input values that produce that result.
In addition to these three tools, you can install add-ins that help you perform what-if analysis, such as the Solver add-in. The Solver add-in is similar to Goal Seek, but it can accommodate more variables. You can also create forecasts by using the fill handle and various commands that are built into Excel. For more advanced models, you can use the Analysis ToolPak add-in.
Use scenarios to consider many different variables
A scenario is a set of values that Excel saves and can substitute automatically in cells on a worksheet. You can create and save different groups of values on a worksheet and then switch to any of these new scenarios to view different results.
For example, suppose you have two budget scenarios: a worst case and a best case. You can use the Scenario Manager feature to create both scenarios on the same worksheet, and then switch between them. For each scenario, you specify the cells that change and the values to use for that scenario. When you switch between scenarios, the result cell changes to reflect the different changing cell values.

1. Changing cells
2. Result cell

1. Changing cells
2. Result cell
If several people have specific information in separate workbooks that you want to use in scenarios, you can collect those workbooks and merge their scenarios.
After you have created or gathered all the scenarios that you need, you can create a scenario summary report that incorporates information from those scenarios. A scenario report displays all the scenario information in one table on a new worksheet.

Note: Scenario reports are not automatically recalculated. If you change the values of a scenario, those changes will not show up in an existing summary report. Instead, you must create a new summary report.
Use Goal Seek to find out how to get a desired result
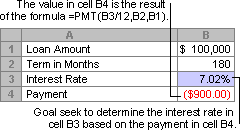
If you know the result that you want from a formula, but you are not sure what input value the formula requires to get that result, you can use the Goal Seek feature. For example, suppose that you need to borrow some money. You know how much money you want, how long a period you want in which to pay off the loan, and how much you can afford to pay each month. You can use Goal Seek to determine what interest rate you must secure in order to meet your loan goal.

Note: Goal Seek works with only one variable input value. If you want to determine more than one input value, for example, the loan amount and the monthly payment amount for a loan, you should instead use the Solver add-in. For more information about the Solver add-in, see the section Prepare forecasts and advanced business models, and follow the links in the See Also section.
Use data tables to see the effects of one or two variables on a formula
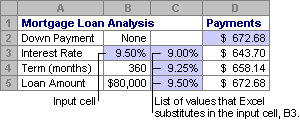
If you have a formula that uses one or two variables, or multiple formulas that all use one common variable, you can use a data table to see all the outcomes in one place. Using data tables makes it easy to examine a range of possibilities at a glance. Because you focus on only one or two variables, results are easy to read and share in tabular form. If automatic recalculation is enabled for the workbook, the data in data tables immediately recalculates; as a result, you always have fresh data.

A data table cannot accommodate more than two variables. If you want to analyze more than two variables, you can use scenarios. Although it is limited to only one or two variables, a data table can use as many different variable values as you want. A scenario can have a maximum of 32 different values, but you can create as many scenarios as you want.
Prepare forecasts and advanced business models
If you want to prepare forecasts, you can use Excel to automatically generate future values that are based on existing data, or to automatically generate extrapolated values that are based on linear trend or growth trend calculations.
You can fill in a series of values that fit a simple linear trend or an exponential growth trend by using the fill handle or the Series command. To extend complex and nonlinear data, you can use worksheet functions or the regression analysis tool in the Analysis ToolPak add-in. For more information, follow the links in the See Also section.
Although Goal Seek can accommodate only one variable, you can project backward for more variables by using the Solver add-in. By using Solver, you can find an optimal value for a formula in one cell — called the objective cell — on a worksheet.
Solver works with a group of cells that are related to the formula in the objective cell. Solver adjusts the values in the changing cells that you specify — called the variable cells — to produce the result that you specify from the target cell formula. You can apply constraints to restrict the values that Solver can use in the model, and the constraints can refer to other cells that affect the objective cell formula.
No comments:
Post a Comment