Create a Data View
Your enterprise collects and stores data — lots of data. To make this data easily accessible and actionable to you and your team, you want to create a tracking or reporting application on your team's Microsoft SharePoint site. Where do you start?
With Microsoft Office SharePoint Designer 2007, you can quickly create a customized view of live data, called a Data View. You can use a Data View to view data from a wide variety of sources, including database queries, XML documents, Web services, SharePoint lists and libraries, and server-side scripts.
There are two ways to insert a Data View into your page. You can create a Data View by dragging the data source from the Folder List or Data Source Library onto a new or existing page in your Web site. Or you can create a Data View by using the Insert Data View command, and then begin modifying the view right away by inserting only the fields that you want to display from the Data Source Details task pane.
This article introduces Data Views. In addition, this article shows you how to create a sample XML file to use as a data source, and then how to create a Data View based on that data by using first the drag-and-drop method, and then the Data Source Details task pane. This article uses an .xml file as a data source so that you can easily create the data source and follow along. However, the following procedures work with any data source — especially SharePoint list data, which might be your most common data source for creating a Data View.
Important: This article discusses creating Data Views in SharePoint sites that are located on servers running Windows SharePoint Services 3.0. Not all functionality may be available if your site is not located on a server running Windows SharePoint Services 3.0.
In this article
What is a Data View?
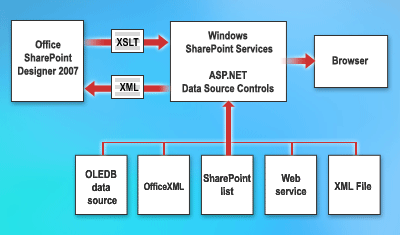
A Data View is a live, customizable view of a data source that leverages Microsoft ASP.NET technology. Office SharePoint Designer 2007 retrieves data from a data source in the form of Extensible Markup Language (XML) and displays that data by using Extensible Stylesheet Language Transformations (XSLTs). You can modify a Data View by using Office SharePoint Designer 2007. A Data View can display data from a wide variety of sources, including database queries, XML documents, Web services, SharePoint lists and libraries, and server-side scripts. You can also create a Data View that displays data from multiple data sources.

Data Views present live views of data that you can filter, sort, or group. You can also change the layout, apply styles, or apply conditional formatting in a completely WYSIWYG (what you see is what you get) environment.
After you insert a Data View into your page, you can also use the WYSIWYG tools in Office SharePoint Designer 2007 to add or remove columns, change font formatting, or apply colors. When you format a Data View by using the WYSIWYG tools available in Office SharePoint Designer 2007, Extensible Stylesheet Language (XSL) is inserted directly into the HTML. While it is possible to edit the XSL directly in Code view, you can use the formatting tools in Office SharePoint Designer 2007 to apply XSL quickly and easily without knowing any XSL.
Create an .xml file as a sample data source
Northwind Traders is a gourmet food distribution company that keeps its product list in XML format. The product list includes inventory information. Right now, your team tracks inventory by printing reports that are distributed to other teams. You suggest that they create a Data View on their intranet site so that teams across the company can access product inventory information quickly and easily, eliminating the need for printed inventory reports.
The following procedures require using an .xml file as a data source. If you don't have an .xml file in your SharePoint site, you first need to create the Northwind Traders product list. After you create the list, you can create a view of the data contained in the list by using a Data View.
Create products.xml
-
On the File menu, click Open Site.
-
In the Open Site dialog box, browse to and select your SharePoint site, and then click Open.
-
If prompted, in the Connect to dialog box, type your user name and password, and then click OK.
-
On the File menu, click New.
-
In the New dialog box, double-click Text File.
A new text file opens in your Web site.
-
Copy the following lines of code by selecting them and then pressing CTRL+C.
              <?xml version="1.0" encoding="utf-8"?>
<ProductsRoot>
 <Products>
 <ProductID>1</ProductID>
 <ProductName>Chai</ProductName>
 <SupplierID>1</SupplierID>
 <CategoryID>1</CategoryID>
 <QuantityPerUnit>10 boxes x 20 bags</QuantityPerUnit>
 <UnitPrice>18</UnitPrice>
 <UnitsInStock>39</UnitsInStock>
 <UnitsOnOrder>0</UnitsOnOrder>
 <ReorderLevel>10</ReorderLevel>
 <Discontinued>0</Discontinued>
 </Products>
 <Products>
 <ProductID>2</ProductID>
 <ProductName>Chang</ProductName>
 <SupplierID>1</SupplierID>
 <CategoryID>1</CategoryID>
 <QuantityPerUnit>24 - 12 oz bottles</QuantityPerUnit>
 <UnitPrice>19</UnitPrice>
 <UnitsInStock>17</UnitsInStock>
 <UnitsOnOrder>40</UnitsOnOrder>
 <ReorderLevel>25</ReorderLevel>
 <Discontinued>0</Discontinued>
 </Products>
 <Products>
 <ProductID>3</ProductID>
 <ProductName>Aniseed Syrup</ProductName>
 <SupplierID>1</SupplierID>
 <CategoryID>2</CategoryID>
 <QuantityPerUnit>12 - 550 ml bottles</QuantityPerUnit>
 <UnitPrice>10</UnitPrice>
 <UnitsInStock>13</UnitsInStock>
 <UnitsOnOrder>70</UnitsOnOrder>
 <ReorderLevel>25</ReorderLevel>
 <Discontinued>0</Discontinued>
 </Products>
 <Products>
 <ProductID>4</ProductID>
 <ProductName>Chef Anton's Cajun Seasoning</ProductName>
 <SupplierID>2</SupplierID>
 <CategoryID>2</CategoryID>
 <QuantityPerUnit>48 - 6 oz jars</QuantityPerUnit>
 <UnitPrice>22</UnitPrice>
 <UnitsInStock>53</UnitsInStock>
 <UnitsOnOrder>0</UnitsOnOrder>
 <ReorderLevel>0</ReorderLevel>
 <Discontinued>0</Discontinued>
 </Products>
 <Products>
 <ProductID>5</ProductID>
 <ProductName>Chef Anton's Gumbo Mix</ProductName>
 <SupplierID>2</SupplierID>
 <CategoryID>2</CategoryID>
 <QuantityPerUnit>36 boxes</QuantityPerUnit>
 <UnitPrice>21.35</UnitPrice>
 <UnitsInStock>0</UnitsInStock>
 <UnitsOnOrder>0</UnitsOnOrder>
 <ReorderLevel>0</ReorderLevel>
 <Discontinued>1</Discontinued>
 </Products>
</ProductsRoot> -
In Office SharePoint Designer 2007, position the insertion point at the top of the page, and then press CTRL+V to paste the code that you just copied into the page.
-
On the File menu, click Save As.
-
In the Save As dialog box, in the File name box, type products.xml.
-
In the Save as type list, click XML, and then click Save.
Create a Data View by dragging the data source onto the page
When you drag a data source onto a page, the result is a default view of the data with the first five fields in your data source appearing in each row in a basic table. However, the Data View is completely customizable. After you insert the Data View, you can easily add columns to or remove columns from the Data View to best suit your needs. For more information, see the topic Modify the columns in a Data View.
Data Views are based on Microsoft ASP.NET 2.0 technology. To create a Data View, you must start with an ASP.NET page (.aspx file). In this example, you will create a new ASP.NET page, and then create a Data View by dragging the data source onto the page.
-
On the File menu, click New.
-
In the New dialog box, double-click ASPX.
A new page with a FORM tag opens.

-
Do one of the following:
-
In the Folder List, locate your data source — in this example, products.xml — and then drag it onto the page.
-
On the Task Panes menu, click Data Source Library. In the Data Source Library task pane, locate your data source — in this example, products.xml — and then drag it onto the page.
A Data View is now displayed on your page, and the Data Source Details task pane opens.
 The first five fields appear in a basic table layout.
-
Create a Data View by using the Data Source Details task pane
When you create a Data View by using the Data Source Details task pane, you first insert a Data View into the page. You then select a data source in the Data Source Library, a task pane that manages available data sources for a SharePoint site. After you select your data source, the Data Source Details task pane opens. In the Data Source Details task pane, you choose the fields that you want to display and then insert them into the Data View.
Data Views are based on ASP.NET 2.0 technology. To create a Data View, you must start with an ASP.NET page (.aspx file). In this example, you will create a new ASP.NET page, and then create a Data View by using the Data Source Details task pane.
-
On the File menu, click New.
-
In the New dialog box, double-click ASPX.
A new page with a FORM tag opens.

-
On the Data View menu, click Insert Data View.
An empty Data View is now displayed on the page, and the Data Source Library task pane opens.

Now that you have inserted the Data View, you are ready to add data.
-
In the Data Source Library task pane, locate your data source, click it, and then click Show Data.
In the example, under XML Files, click products.xml, and then click Show Data. If the XML Files heading is collapsed, click the plus sign (+) to expand it.
-
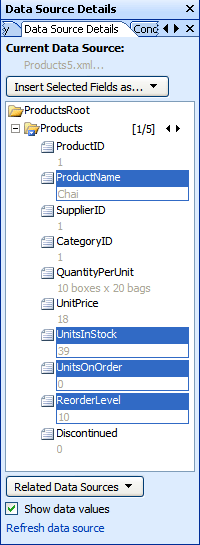
In the Data Source Details task pane, click the fields that you want to insert in the Data View.
Tip: To select multiple fields, hold down CTRL while you click them.
In the example, in the ProductsRoot folder, under Products, click ProductName. Press and hold down CTRL while you click UnitsInStock, UnitsOnOrder, and ReorderLevel.

-
Click Insert Selected Fields as, and then click Multiple Item View to insert the selected data into the Data View.
Note: Single Item View displays a single record in a Data View. Multiple Item View displays multiple records, with the fields in columns with headings for each column.
The fields that you selected in the Data Source Details task pane now appear in a table.

After you create a Data View, you can use WYSIWIG tools such as the Formatting toolbar to modify fonts, align text, or apply colors. When you apply new formatting to a data point in your Data View, Office SharePoint Designer 2007 applies the formatting to all of the data at the same level in the XML by modifying the XSLT style sheet attached to the page. For example, in the previous illustration, if you select Chai and then click Bold on the Formatting toolbar, Office SharePoint Designer 2007 applies the same formatting to all of the content that appears in the ProductName field.

Suggested next steps
Data Views are powerful, fully customizable views of live data. Now that you have learned how to create a Data View, you might want to learn how to:
-
Filter data in a Data View You can easily filter the data in a Data View. For more information, see Filter data in a Data View.
-
Sort and group data in a Data View You can quickly sort or group the data in a Data View. For more information, see Sort and group data in a Data View.
-
Apply conditional formatting to a Data View You can apply specific formatting to a Data View when the data in the Data View meets certain conditions. For more information, see Apply conditional formatting to a Data View.
-
Create a formula column in a Data View You can create a calculated column that displays the result of a calculation of other columns in a Data View, just as with a spreadsheet. For example, you can multiply the unit price by the number of units in stock and display the total value of the items in a separate column. For more information, see Create a formula column in a Data View.
-
Modify columns in a Data View You can quickly and easily add, remove, or arrange columns in a Data View. For more information, see Modify the columns in a Data View.
-
Display data from multiple sources in a single Data View You can link two or more related data sources and display data from those sources in a single Data View. For more information, see Display data from multiple sources in a single Data View.
-
Display sample data in a Data View You can easily display sample data in a Data View.
No comments:
Post a Comment