Hierarchies in Power View
If your data model has a hierarchy, you can use it in Power View. You can also create a new hierarchy from scratch in Power View.
The advantage of having the hierarchy in a data model is that you can use it in every Power View sheet or report you build on that data model. You can only create a hierarchy in the Data Model in Excel by going to the Power Pivot window. Read about creating hierarchies in Power Pivot.

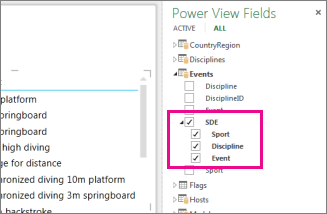
This data model already has a hierarchy called SDE, consisting of the fields Sport > Discipline > Event. With one click you can add the hierarchy to a Power View report.

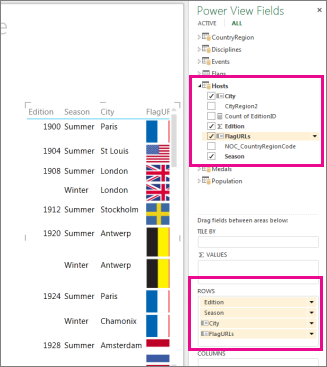
If your data model doesn't have a hierarchy, you can create one in Power View, too. Just adding multiple fields to the Rows or Columns box for a matrix creates a hierarchy for that matrix. Adding multiple fields to the Axis box of a chart creates a hierarchy for that chart. With this hierarchy, you can now drill up and drill down in the chart or matrix.
You can put fields in any order in a hierarchy. It needn't be a natural hierarchy like Category > Subcategory > Product. It could be Category > Year > Continent.

SQL Server Analysis Services tabular models can also have hierarchies that you can use in Power View sheets or reports.
See Also
Add drill-down to a Power View chart or matrix
Power View: Explore, visualize, and present your data
Power View and Power Pivot videos
Working with a matrix in Power View
Tutorial: PivotTable data analysis using a Data Model in Excel 2013
No comments:
Post a Comment