In Visio Professional, a data graphic can be moved, or repositioned.
Tip: Move data graphics after you have imported data and configured your data bars, icon sets, and text callout data graphics.
Move data graphics for one or two shapes
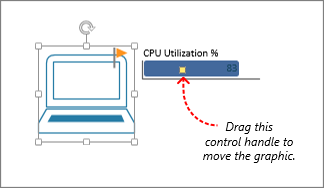
You can move a data graphic for one or two shapes. You do this by manually moving the control handle. Click the shape to select it, and drag the control handle for the data graphic:

Moving data graphics for many shapes
If you want to move the data graphics for more than one shape, follow this process:
-
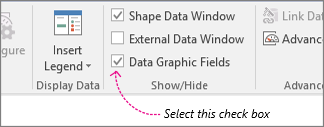
Make sure the Data Graphic Fields pane is open on the right. If it isn't open, on the Data tab, click to select the Data Graphic Fields check box.

-
Do one of the following:
-
If you want to move all shapes on the page, click an empty space on the diagram to deselect any shapes that may be selected.
-
If you want to move only select shapes on the page, click one or more shapes to select them.
-
-
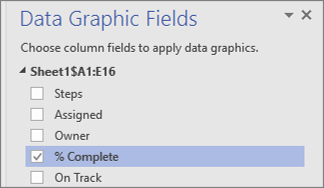
In the Data Graphic Fields pane, identify which field of data you want to move data graphics for.
-
In the same pane, make sure the field you want to change has a check mark, and make sure to select it so that it is highlighted in blue:

-
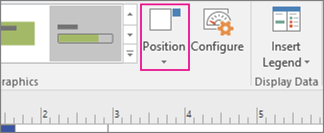
On the Data tab, click the Position button.

-
Then choose a position option. The white box represents the shape, and the smaller blue box represents the data graphic you want to move.

Thank you for sharing best information I well share with my friends thank you
ReplyDeletebest Movers in dubai
furniture Movers in dubai
house moving
shifting sarvice
office moving