Measures, also known as measures in Power Pivot in Excel 2013, are calculations used in data analysis. Examples commonly found in business reports include sums, averages, minimum or maximum values, counts, or more advanced calculations that you create using a Data Analysis Expressions (DAX) formula.
In a PivotTable, PivotChart, or report, a measure is placed in the VALUES area, where the row and column labels that surround it determine the context of the value. For example, if you are measuring sales by year (on columns) and region (on rows), the value of the measure is calculated based on a given year and region. The value of a measure always changes in response to selections on rows, columns, and filters, allowing for ad hoc data exploration.
While measures and calculated columns are similar in that both are based on a formula, they differ in how they are used. Measures are most often used in the VALUES area of a PivotTable or PivotChart. Calculated columns are used when you want to place calculated results in a different area of a PivotTable (such as a column or row in a PivotTable, or on an axis in PivotChart). It's very important to understand when to use measures instead of a calculated column and vice-versa. For more information, see Calculations in Power Pivot and Calculated Columns in Power Pivot.
Understanding Measures
Measures are either implicit or explicit, which affects how you use them in a PivotTable or PivotChart, and in other applications that use a Power Pivot Data Model as a data source.
Implicit Calculated Field
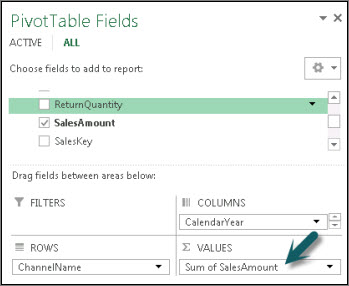
An implicit measure is created by Excel when you drag a field, such as Sales Amount, to the VALUES area of the PivotTable Fields list. Because implicit measures are generated by Excel, you might not be aware that a new measure has been created. But if you examine the VALUES list closely, you will see that the Sales Amount field is actually a measure named Sum of Sales Amount and appears with that name in both the VALUES area of the PivotTable Fields list, and on the PivotTable itself.
Implicit measure created in a PivotTable

Implicit measures can only use a standard aggregation (SUM, COUNT, MIN, MAX, DISTINCTCOUNT, or AVG), and must use the data format defined for that aggregation. In addition, implicit measures can only be used by the PivotTable or chart for which they were created.
An implicit measure is tightly coupled with the field upon which it is based, affecting how you delete or modify the measure later on.
Explicit Calculated Field
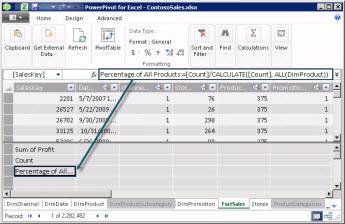
An explicit measure is created by you when you type or select a formula in a cell in the Calculation Area, or by using the AutoSum feature in the Power Pivot window. Most measures you create will be explicit.
Explicit measure created in the Power Pivot Calculation Area

Explicit measures can be used by any PivotTable or PivotChart in the workbook and by Power View reports. Moreover, they can be extended to become a KPI, or formatted using one of the many strings available for numeric data. Context menu commands for Create KPI and Format are only available when you are using an explicit calculated field.
Note: Once you use a measure as a KPI, you cannot use it for other calculations; you must make a copy if you want to use the formula in calculations as well. For more information about KPIs, see Key Performance Indicators (KPIs) in Power Pivot.
Example
The sales manager at Adventure Works has been asked to provide reseller sales projections over the next fiscal year. She decides to base her estimates on last year's sales amounts, with a six percent annual increase resulting from various promotions that are scheduled over the next six months.
To develop the estimates, she imports last year's reseller sales data and adds a PivotTable. She finds the Sales Amount field in the Reseller Sales table and drags it to the VALUES area of the PivotTable Fields list. The field appears on the PivotTable as single value that is the sum of all reseller sales from last year. She notices that even though she did not specify the calculation herself, a calculation has been provided automatically, and the field has been renamed to Sum of Sales Amount in the field list and on the PivotTable. A built-in aggregation added by Excel, =SUM('FactResellerSales'[SalesAmount]) provides the calculation. She renames the implicit measure Last Year Sales.
The next calculation is sales projection for the coming year, which will be based on last year's sales multiplied by 1.06 to account for the expected 6 percent increase in reseller business. For this calculation, she must create the measure explicitly, using the New Calculated Field button to create a calculation named Projected Sales. She fills in the following formula: =SUM('FactResellerSales'[SalesAmount])*1.06.
The new measure is added to VALUES area in the PivotTable Fields list. It is also added to the table that is currently active in the PivotTable Fields list. The table provides a location for the measure in the workbook. Because she prefers to have the measure in a different table, she edits the measure to change its table association.
Very quickly and with minimal effort on her part, the sales manager has the basic information in place. She can now further assess her projections by filtering on specific resellers or by adding product line information to verify that the future promotions are for products that the reseller carries.
Naming Measures
You can rearrange and rename measures after they are created. However, there are some restrictions on changes to measures:
-
Measures appear in the PivotTable Fields list (unless they are hidden) along with other objects. Consider naming them in a way that easily identifies the action they will perform.
-
Each measure name should be unique within a table.
-
Avoid names that have already been used for calculated columns within the same workbook. Although it is possible for a measure and a calculated column to have the same name, if names are not unique you can get calculation errors.
-
When you rename a measure, any formulas that invoke it in a formula should also be updated. Unless you are in manual update mode, updating the results of formulas takes place automatically. However, this operation might take some time.
-
Because the name is part of the measure's formula, there are some characters that cannot be used within the name. For more information, see "Naming Requirements" "in DAX syntax.
Tip: You can group measures from multiple tables into one table by creating an empty table, and then move or create new measures in there. Keep in-mind, you may need to include table names in DAX formulas when referring to columns in other tables.
Tasks
The following article contains instructions on how to create both implicit and explicit calculated fields.
No comments:
Post a Comment