Change chart type in Office 2016 for Mac
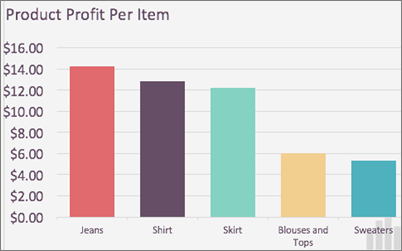
Let's say you have a clustered column chart type, but for your presentation, you would like to show a pie chart. You can change the type of chart you think would best represent your data at any time.
-
To change the Clustered Column to Pie, select your chart.

-
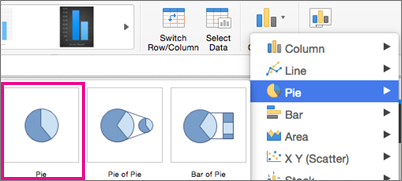
On the Chart Design tab, click Change Chart Type > Pie > Pie.

Your new chart type will show in your file.

No comments:
Post a Comment