Create a Visio 2007 organization chart from Excel 2007 worksheet data
Advanced Microsoft® Office Documents 2007 Edition Inside Out
By Stephanie Krieger
Stephanie Krieger is a Microsoft Office System MVP as well as author of the books Advanced Microsoft Office Documents 2007 Edition Inside Out and Microsoft Office Document Designer. As a professional document consultant, she has helped many global companies develop enterprise solutions for Microsoft Office and taught numerous professionals to build great documents by understanding how the Office programs "think." Stephanie writes regularly for several Microsoft Web pages and frequently delivers Microsoft Office webcasts.
To learn more about other books on the 2007 Microsoft Office system, visit Microsoft Press.
Create a Visio organization chart from worksheet data
This feature is not new, but it is pretty impressive. Just type a list of names, titles, and managers in an Excel worksheet and Visio will create even the most extensive organization chart for you in a couple of clicks.
Note: Depending on your needs for an organization chart, you might want to use this feature or the new SmartArt diagrams in PowerPoint. For large, intricate organization charts, Visio is the more flexible choice. But, when you create SmartArt diagrams in PowerPoint, you can convert a bulleted list to a diagram in two clicks and then add or revise diagram entries just by typing text. Visio is also a better choice when you want to store data in diagrams or create diagrams that are interactive, such as diagrams with hyperlinks published on a Web page. But, if you just need a high-quality, simple organization chart to add to a document without having to draw any shapes, consider whether a SmartArt diagram might not do the trick for you more easily. Also, unlike Visio diagrams, SmartArt diagrams use the Document Themes, Quick Styles, and graphic effects available across Word, Excel, and PowerPoint. So, your SmartArt organization chart can automatically coordinate with your document.
To create a Visio organization chart from data stored in Excel, do the following.
-
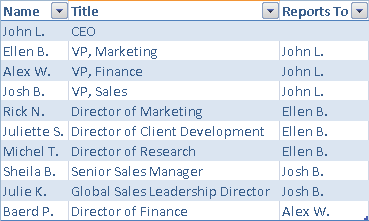
Set up your data in Excel in columns with a single row of headings. Headings will become field names for use in creating the organization chart. The only required fields are a field for the person's name and a field for the person to whom they report. Include other fields as needed for content you want to include in your chart, as you see in the following sample data.

-
In Visio, on the File menu, point to New, point to Business, and then click Organization Chart Wizard.
-
Click Next at the first screen to select data from an existing source file. Notice that data can be in an Excel file, a text file, a Microsoft Office Exchange Server directory, or a database. At the second screen, select the option that includes Excel file and then click Next again. Browse to and select your file, and then click Next once more.
Note: The first screen of the Organization Chart Wizard indicates that .xls files are the Excel file type to use. This screen simply hasn't been updated. Excel 2007 files (such as the sample data file provided) work fine.
-
Once Visio accesses your data, it will attempt to match field names (column headings) to the Name and Reports To fields for the organization chart. Confirm that Visio has selected the correct fields and then click Next.
At this point, you can just click Next until the Finish button becomes available and then click Finish to generate your chart. However, take note of the options at each wizard screen between. On the last wizard screens, you can specify fields from your data to display on the chart and the order in which to display them within shapes, select fields to store in shapes as Shape Data, and specify layout requirements.
When the organization chart is generated from the sample data shown in the preceding steps, it looks like this.

It takes just two more clicks to format this chart with Theme Colors and Theme Effects. You can then add shapes from the Organization Chart Shapes or any other stencil and format them as you would any Visio shape. You can also use options on the Organization Chart menu (this menu appears only for this diagram type), including the following:
-
Select Options to globally apply format settings, such as shape size and text formatting for each visible field (such as italicizing titles).
-
Change the position type (such as executive or manager) for selected shapes.
-
Click Export Organization Data to export all data from your completed organization chart to a new Excel file. Just type a name for the new file and click Save.
Note that this works just as well with organization charts you create from other sources or by drawing shapes. So, for example, if you create your organization chart from Excel data and then add shapes to the chart manually in Visio, when you export that data to Excel, it will include the shapes you've added as well as those that were automatically generated. Also note that, by default, the exported file is saved as an .xlsx file.

Really well information. Thanks a lot. Here, I got the special deals for Microsoft Visio Professional 2016 and many more .Our specialty is quick email delivery. You will get 24/7 support. So let’s check it out.
ReplyDeleteyour posting style is very awesome thanx for sharing keep it up........Microsoft Visio Pro 2013-2016 Product Key & Crack Free Download
ReplyDelete